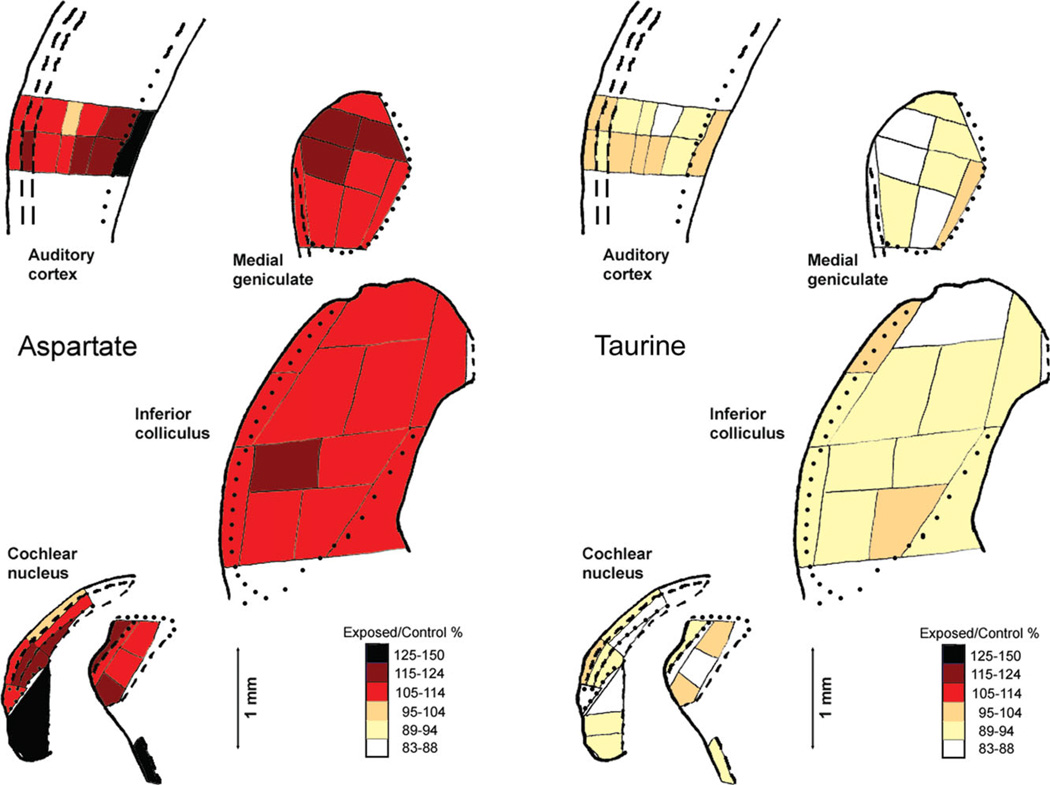
Fig. 5.
Ratios of average exposed-hamster concentrations to average control-hamster concentrations, coded as percentages, for aspartate and taurine in auditory brain regions. The maps and details are the same as in Figure 1, in which regional identifications are shown. The ratio for taurine in the PVCN granular region (70%) was outside the range of the codes, but an additional code was not added to accommodate this one sample. [Color figure can be viewed in the online issue, which is available at wileyonlinelibrary.com.]

