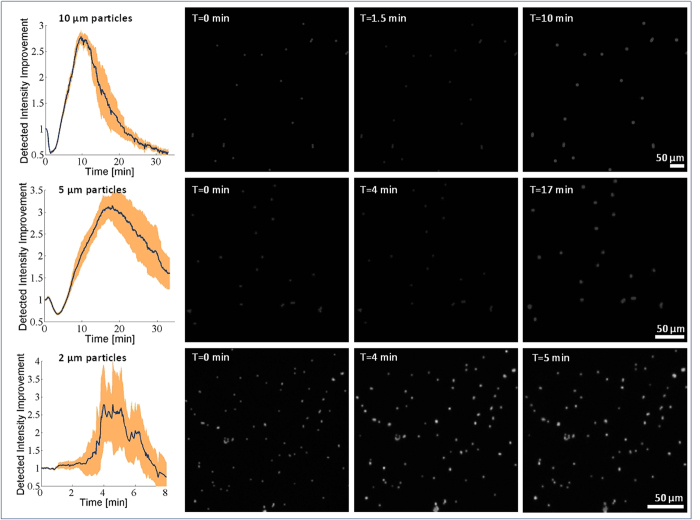
Figure 2. Measured fluorescent intensity enhancement during the PEG micro-reflector formation process for 10 μm, 5 μm, and 2 μm fluorescent beads, respectively.
Fluorescent microscope (4×; NA = 0.13) images are shown at different time points. The width of the shaded orange region for each curve is equal to twice its standard deviation.

