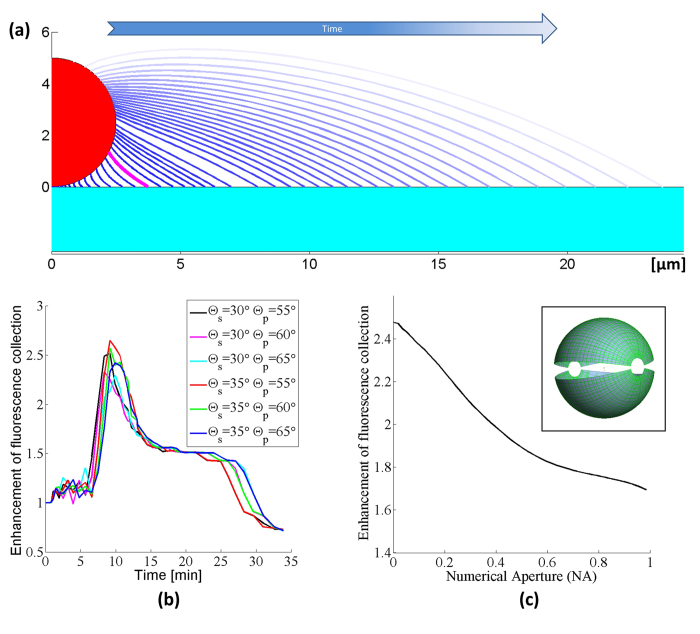
Figure 3. (a) Simulated reflector shapes with contact angles Θs = 30°, Θp = 60°. The size of the liquid meniscus increases with time as the vapor is deposited.
The meniscus corresponding to the maximum enhancement of fluorescence collection is drawn in magenta. (b) The predicted enhancement factors resulting from ray tracing simulations for various substrate (Θs) and particle (Θp) contact angles. The set of contact angles best matching the experimental case is shown in magenta. (c) Calculated emitted intensity improvement of the magenta-colored reflector shape vs. the numerical aperture of the optical system (contact angles: Θs = 30° ; Θp = 60°) using a spherical 5 μm fluorescent particle. The light is mainly redirected towards the optical axis of the imaging system. During the non-sequential ray tracing simulations, 2000 emitters are placed randomly into the fluorescent sphere with uniform distribution. Every emitter releases 2000 rays into the full 4π solid angle with uniform distribution for a total starting ray count of 10 million. The simulation assumes a perfect spherical particle before the micro-reflector deposition, thus ~50% of the emission is initially confined inside the particle due to the total internal reflection on the particle surface. Inset shows the detectors located ~10 cm above and below the bead. The two hemispheres detect the emitted intensity into angles between −80° to 80° with an angular bin size of 1°.

