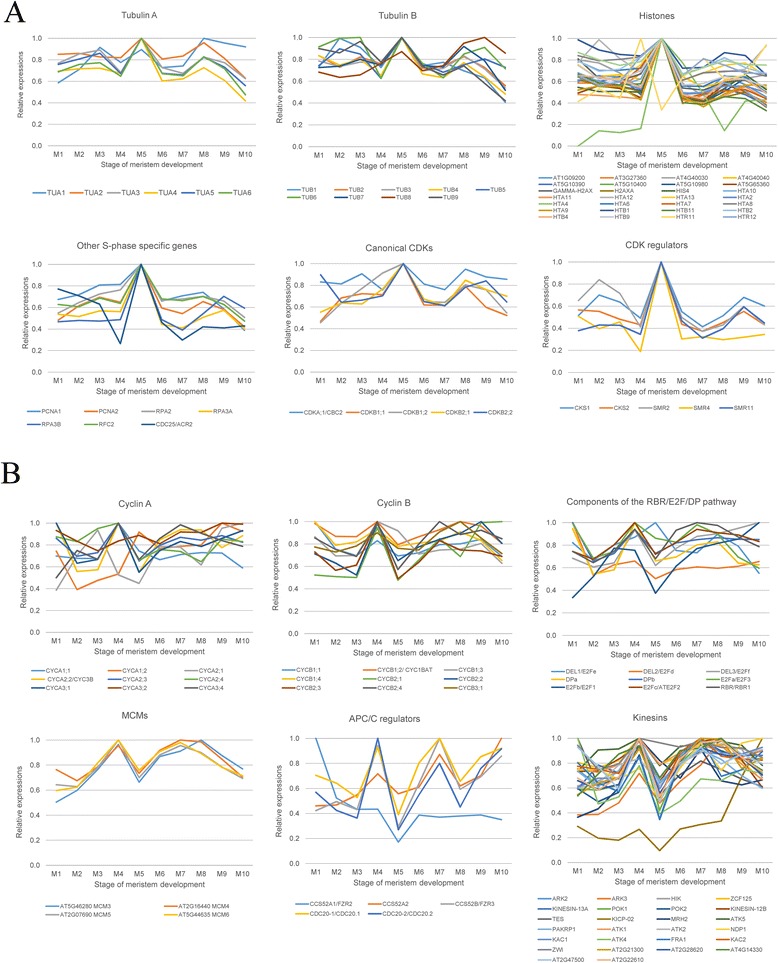
Fig. 4.

Expression profiles of specific gene classes. Some groups of genes have a synchronized behavior. (a) Genes that belong to type (I) of expression pattern have a pronounced peak in M5. (b) Genes of type (II) are upregulated in M4 and M6, with a decrease in M5. Relative expression values for the gene classes, normalized to the highest values for each gene, are presented
