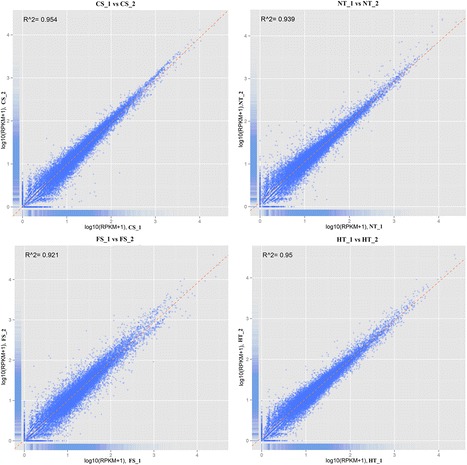
Figure 2.

Correlation tests for the replicates. The abscissa represents the value log10 (RPKM + 1) of one duplicate; the ordinate represents the value log10 (RPKM + 1) of the other duplicate. R2 is the square of Pearson Correlation Coefficient.

Correlation tests for the replicates. The abscissa represents the value log10 (RPKM + 1) of one duplicate; the ordinate represents the value log10 (RPKM + 1) of the other duplicate. R2 is the square of Pearson Correlation Coefficient.