Figure 3.

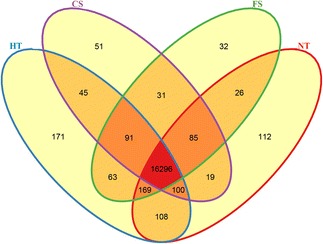
Venn diagram showing the number of expressed unigenes in the NT, HT, CS, and FS treatments. This Venn diagram was drawn using the number of genes expressed (RPKM > 0.3) in the four treatments (FS, HT, CS, and NT).

Venn diagram showing the number of expressed unigenes in the NT, HT, CS, and FS treatments. This Venn diagram was drawn using the number of genes expressed (RPKM > 0.3) in the four treatments (FS, HT, CS, and NT).