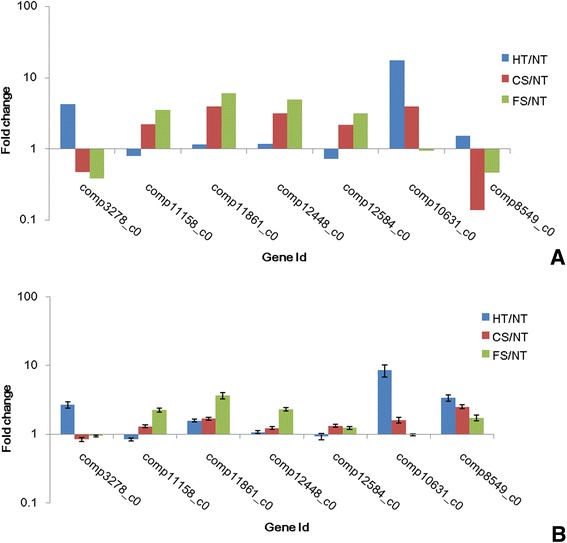
Figure 8.

RT-PCR analysis of 7 randomly selected unigenes. ((A) Gene expression data for DGE analysis. The fold changes of the genes were calculated as the log2 vaule of HT/NT, CS/NT and FS/NT and shown on the y-axis. (B) The qRT-PCR analysis of gene expression data. Expression ratios of these genes in HT, CS and FS were compared to NT, respectively).
