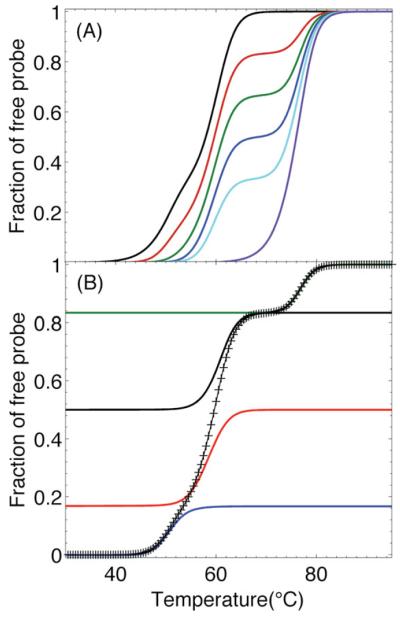
FIGURE 4.
A,B: Simulations of the fraction of free probe under the conditions of the UV experiments shown in Figure 3a. (A) All samples contained 0.7 μM each of P, , , and . From left to right, the ratios of T to P were 0, 0.5, 1.0, 1.5, 2.0, and 3.0, which are the same ratios as for the experimental data in Figure 3. (B) Breakdown of the simulated curve for a ratio of 0.5 Target to Probe (+) into contributions from (blue curve), (red curve), (black curve), and T (green curve).

