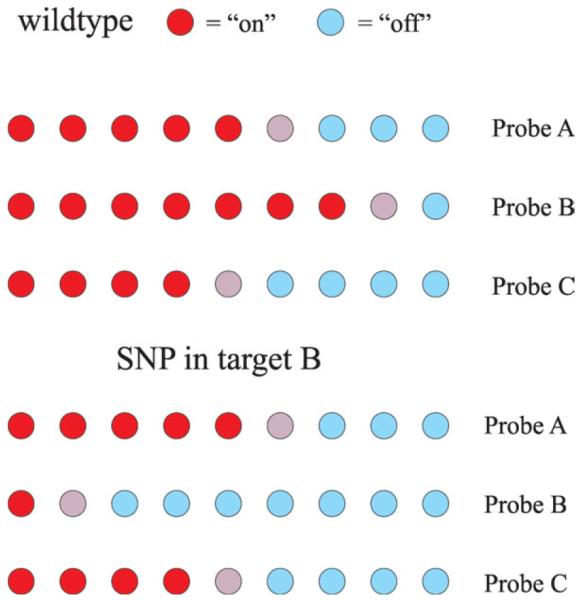
FIGURE 6.

Illustration of how the DNA meter can be used to determine SNPs. Targets A, B, and C are on the same amplicon, and probes A, B, and C are for these respective targets. For the wildtype, a characteristic pattern of tunable probes turned “on” is observed. When a SNP occurs in target B, fewer probes for this target are turned “on” and the characteristic pattern is disrupted.
