
Figure 3.
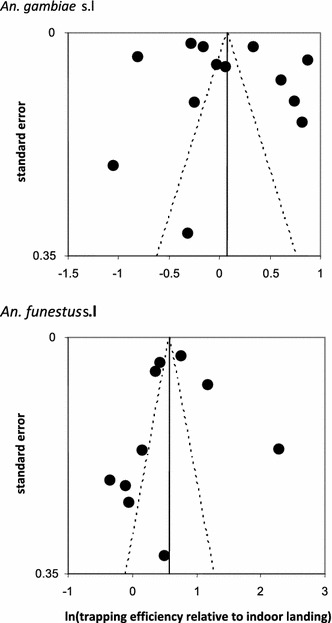
Representativeness of studied sites. Funnel plots giving the logarithm of the estimated sampling efficacy for each study (horizontal axis), standard error (se) of this estimate (vertical axis). The vertical line corresponds to the estimated overall average sampling efficacy. The dashed lines correspond to 95% pseudo-confidence limits calculated as 1.96 ± se within which 95% of the points are expected to occur in the event that the differences between studies arise only because of sampling variation.