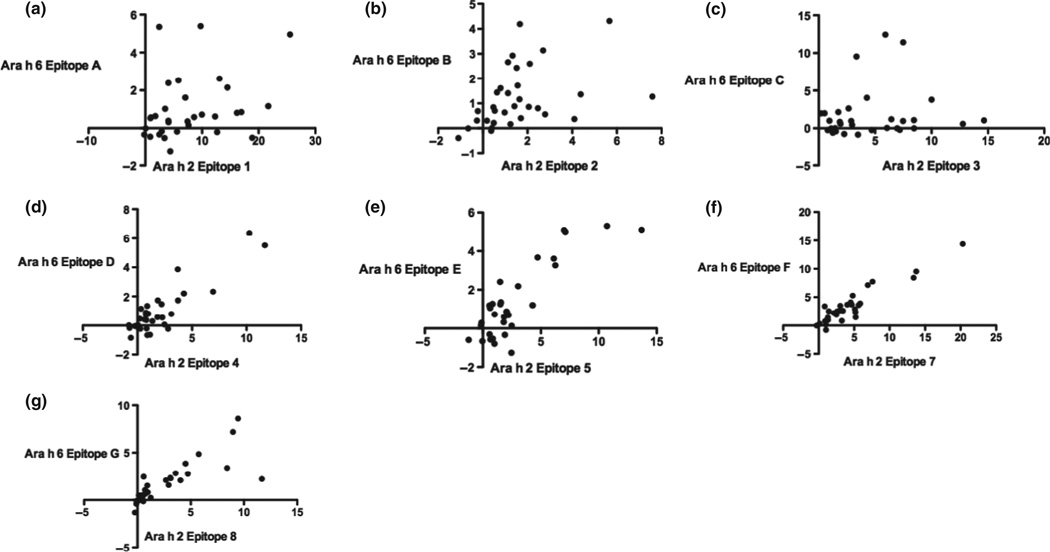
Fig. 3.
Correlation of IgE binding to linear epitopes. Spearman correlation analysis was performed with z-scores for each homologous pair of epitopes of Ara h 2 and Ara h 6 (horizontal and vertical axes, respectively): epitope 1 of Ara h 2 and epitope A of Ara h 6 (a, r = 0.37, P = 0.04, pc = ns); epitope 2 of Ara h 2 and epitope B of Ara h 6 (b, r = 0.55, pc = 0.01); epitope 3 of Ara h 2 and epitope C of Ara h 6 (c, r = 0.21, pc = ns); epitope 4 of Ara h 2 and epitope D of Ara h 6 (d, r = 0.64, pc < 0.01); epitope 5 of Ara h 2 and epitope E of Ara h 6 (e, r = 0.65, pc < 0.01); epitope 7 of Ara h 2 and epitope F of Ara h 6 (f, r = 0.82, pc < 0.001); and epitope 8 of Ara h 2 and epitope G of Ara h 6 (g, r = 0.90, pc < 0.001).

