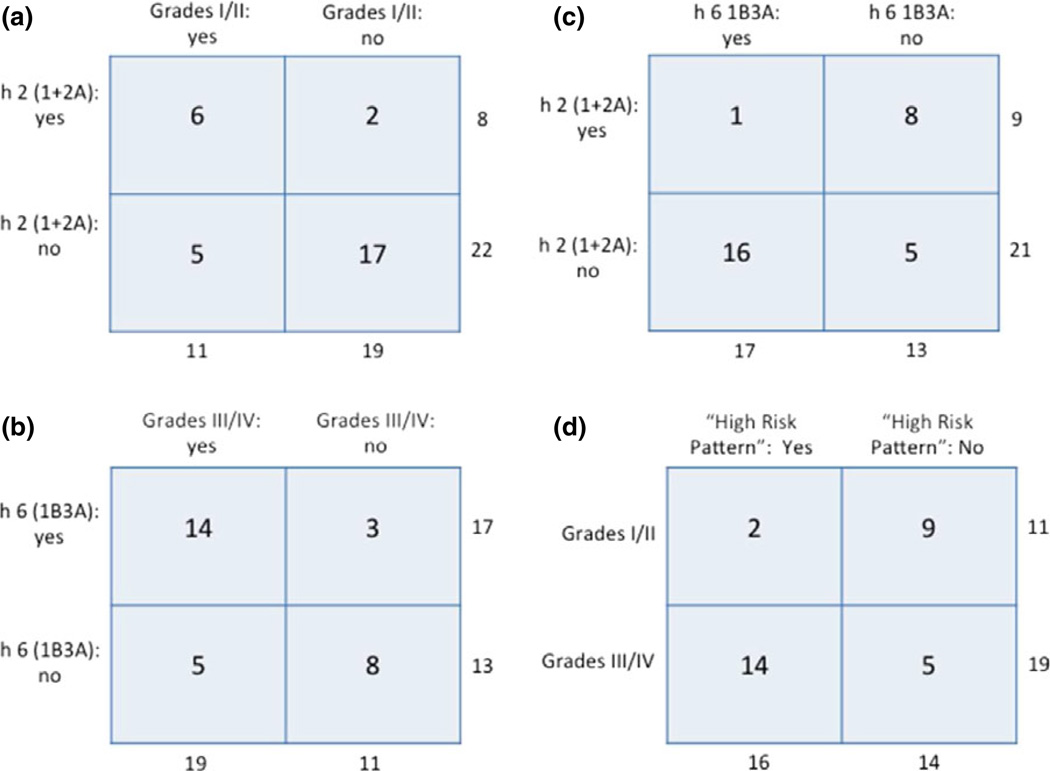
Fig. 6.
Contingency plots of key data from the unsupervised cluster analysis shown in Fig. 5. Totals for each horizontal and vertical set of numbers are shown. For all plots, n = 30. (a) Frequency of subjects with a history of grades I or II severity cluster in either node 1 or 2A of Ara h 2 (P = 0.03); (b) frequency of subjects with a history of grades III or IV severity cluster in node 2B2B1 of Ara h 6 (P = 0.02); (c) frequency of subjects who cluster in node 2B2B1 of Ara h 6 and do not cluster in either node 1 or 2A of Ara h 2 (P < 0.01); and (d) frequency of subjects having the high-risk pattern [h 6 (2B2B1), yes and h 2 (1 + 2A), no] (P < 0.01).

