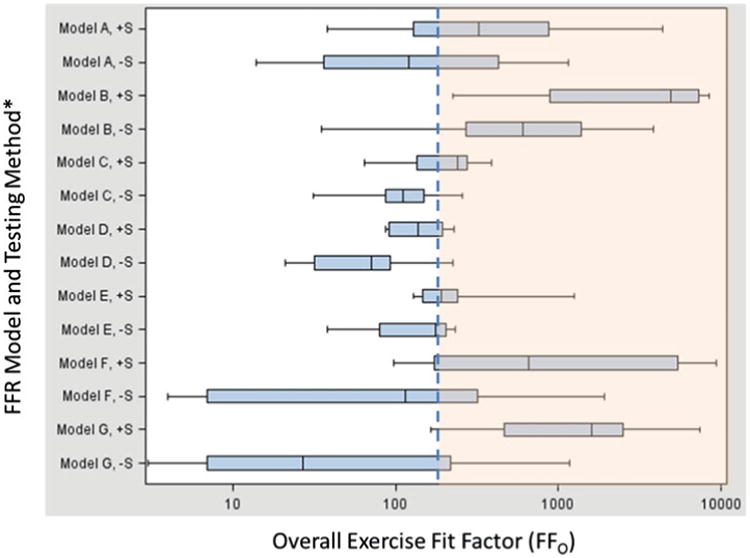
Figure 3.

Overall Exercise Fit Factors by FFR Model and Testing Method. *Notations following FFR Model name: “+S” = Screening method used.“ −S” = Screening method not used. Notes: 1) n = 8 for each FFR model / test method combination (i.e., 8 data points make up each box plot). 2) Vertical lines on the boxplots show (from left to right) lowest value, 25th %ile, 50th %ile, 75th %ile, and highest value. 3) The dashed blue line at 200 indicates the demarcation of overall exercise fit factor (FFO) above and below 200. Results > 200 are shown in the shaded orange area of the graph. Our study utilized a non-commerical version of the FitPlus software to record FFO > 200. The commercial version of the software limits the FFO output to a maximum of 200 (color figure available online).
