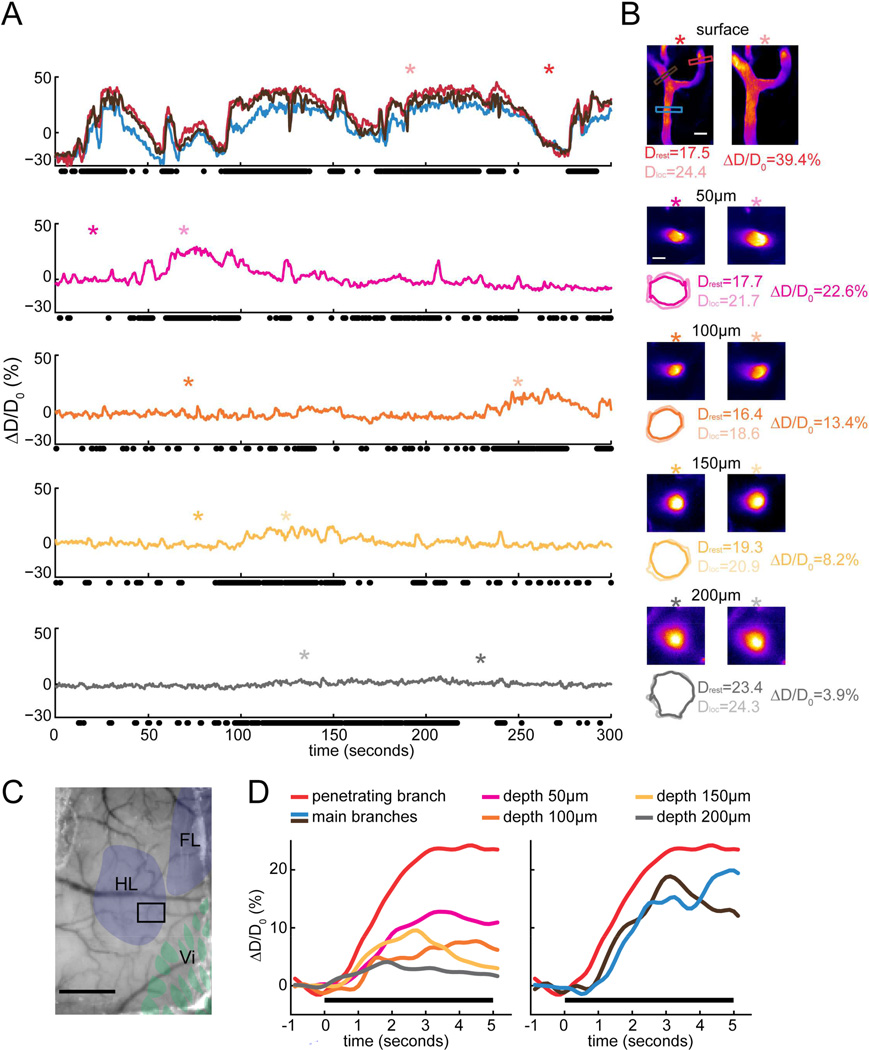
Figure 2. Locomotion-driven dilations of an example arteriole imaged at multiple depths below the surface.
A) Voluntary-locomotion induced diameter changes of an example arteriole measured at the surface and at multiple depths below the cortical surface. The top panel shows the diameter changes of three surface branches. The penetrating branch (enclosed by red box in B) enters into the brain to become intracortical vessel. The lower panels show the diameter changes of this penetrating arteriole in the brain during locomotion from 50 to 200µm below the pia. Black dots below each panel correspond to locomotion events. The asterisks mark the time points where the images of standing and locomoting in B were taken. Note that imaging at each depth was performed sequentially, so locomotion patterns differ at different imaging depths. B) 2PLSM images of the example arteriole at multiple depths. Asterisks show time points from which images are taken. Scale bars 20µm. Colored boxes in the top image correspond to the colored diameter percentage traces in the top panel of A. Numbers on the top of images are the depth below the surface at which the vessel was imaged. Colored contours show vessel outlines detected with the TiRS algorithm, and are enlarged by a factor of two relative to the images. Drest and Dloc are the diameters from the above images during rest and locomotion, respectively. ΔD/D0 is the diameter percentage changes during locomotion relative to rest. C) Photo of PoRTS window with histologically identified somatosensory representations overlaid. HL: hindlimb region, FL: forelimb region, Vi: vibrissae region. The black box encloses the area imaged with 2PLSM that contains the arteriole in A. Scale bar 1mm. D) Locomotion-triggered average of vessel diameter changes at different depth below the cortical surface. Each colored curve was taken from the corresponding time series of the example arteriole in A. Black bars show locomotion.

