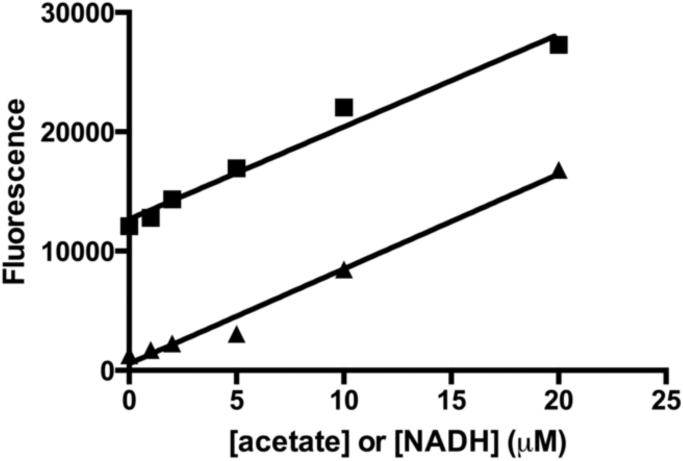
Figure 3.
Standard curve for the acetate assay compared to NADH fluorescence. The fluorescence change observed upon addition of acetate to the coupled assay (■) is compared to the NADH fluorescence under comparable conditions (50 mM HEPES, 100 mM NaCl, 3 mM KCl, 50 mM MgCl, pH 8) (▲). The two slopes are equal, indicating that in the coupled assay one mole of NADH is formed per mole of acetate. The higher background observed in the acetate standard curve is a result of NADH formed before addition of acetate due to the equilibrium of the malate dehydrogenase-catalyzed reaction.

