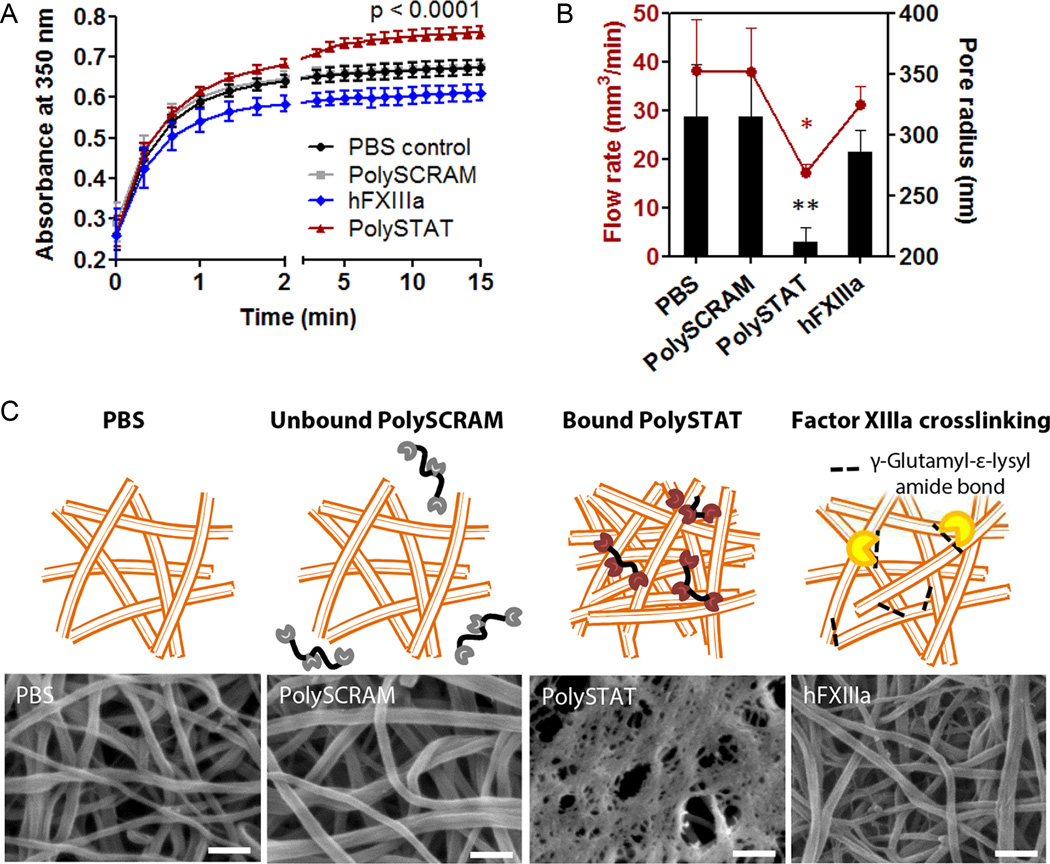
Fig. 2. In vitro characterization of PolySTAT-modified fibrin architecture.
(A)Turbidity of pure fibrin clotting solutions with PBS, PolySCRAM, PolySTAT, and hFXIIIa was measured to determine if there were potential changes in fibrin nanostructure. The p-value shown is for comparison between PBS and PolySTAT at t = 15 min. (B) Flow rates of water through fully-formed fibrin were measured and used to extrapolate pore size using Darcy’s Law and a model by Carr and Hardin (41). P-values are shown for comparison to PolySCRAM (*p = 0.03, **p = 0.01). Data in (A and B) are averages ± SD (n = 3). Statistical significance was determined using one-way ANOVA with Tukey Kramer post hoc test. (C) Fully formed fibrin clots were imaged using scanning electron microscopy to visualize fibrin architecture. hFXIIIa was included for a crosslinking control. Scale bars, 250 nm. Schematics above the SEM images depict the exclusion of non-binding PolySCRAM from fibrin, PolySTAT-induced fibrin crosslinking via binding of fibrin-binding peptides, and enzymatic crosslinking by hFXIIIa. (Schematics are not drawn to scale.)

