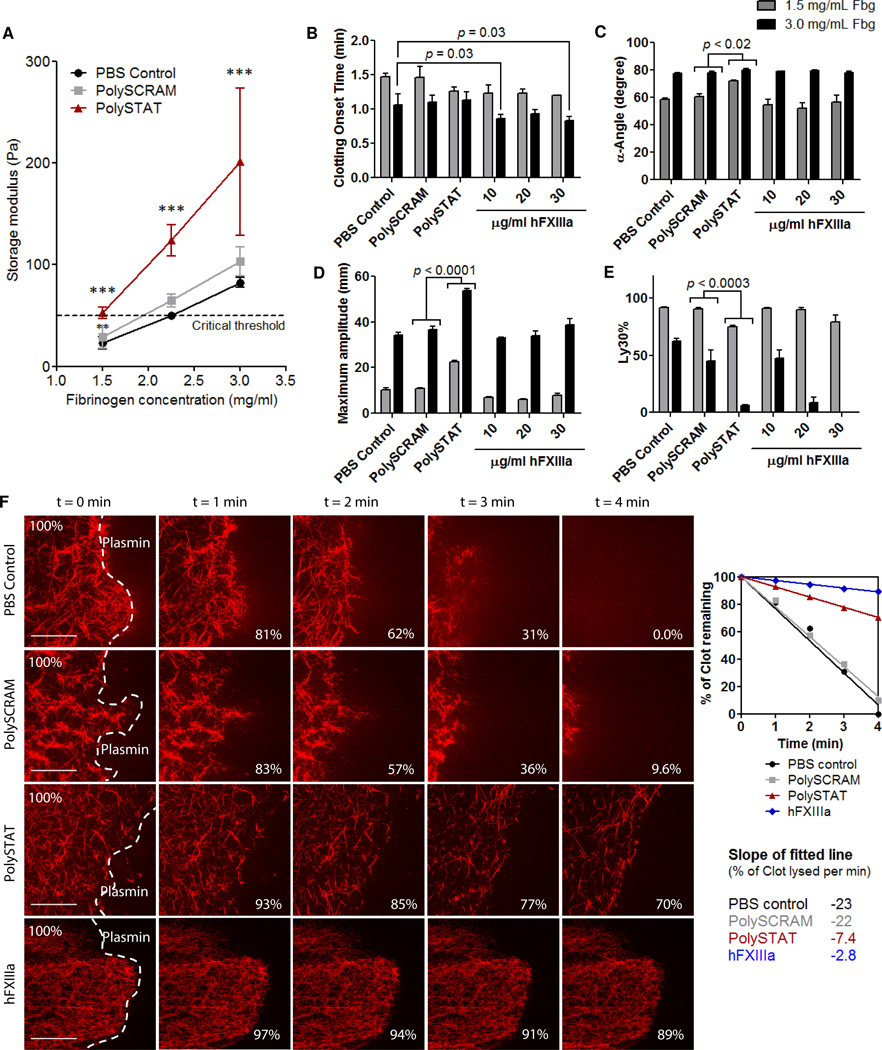
Fig. 3. In vitro characterization of fibrin polymerization kinetics, clot strength, and fibrinolysis.
(A) Cone-and-plate rheometry was used to measure PolySTAT-induced changes in fibrin storage moduli, a measure of elasticity. Measurements were taken for PolySTAT-modfied and control fibrin formed with 1.5, 2.2, and 3.0 mg/ml fibrinogen with intact hFXIIIa (n = 3). The critical threshold indicates the storage moduli below which mortality increases dramatically in trauma patients (26). Data are averages ± SD. ***p < 0.0001 for both effect of treatment and fibrinogen concentration, p = 0.07 for interaction; 2-way ANOVA. The effect of PolySTAT on clotting kinetics, clot strength, and extent of fibrinolysis was evaluated in a hyperfibrinolytic model using TEG. (B to E)Clotting onset time, clotting rate, maximum clot strength, and extent of clot lysis 30 min after time to maximum clot strength are shown. Three hFXIIIa concentrations were included to compare to PolySTAT activity. Data are averages ± SD (n = 3). P-values were determined using one-way ANOVA with TukeyKramer post hoc test. (F) Lysis of fibrin was visualized using confocal microscopy. Plasmin (10 µg/ml) was applied to the edge of fully-formed fibrin clots and time-lapsed images were taken. Image processing was used to measure the area of the clot in acquired images and determine rate of clot lysis. Scalebars, 50 µm.

