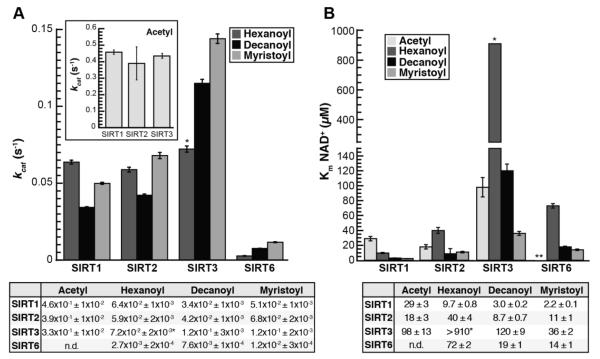
Figure 2. kcat and Km, NAD for SIRT1, SIRT2, SIRT3, and SIRT6 deacylation reactions.
A, kcat, inset: kcat for acetylated substrate plotted separately for clarity; Calculated kcat values determined from non-linear regression fits to Michaelis-Menten shown below (n ≥ 3, ± standard deviation). *Estimate for SIRT3 resulting from inability to saturate reaction with NAD+. B, Km for NAD+, Calculated Km, NAD values determined from non-linear regression fits to Michaelis-Menten shown below. *Estimate for SIRT3, **Km, NAD with acetylated peptide for SIRT6 was not measured due to prohibitively high peptide substrate necessary to saturate the reaction (n ≥ 3, ± standard deviation of mean).

