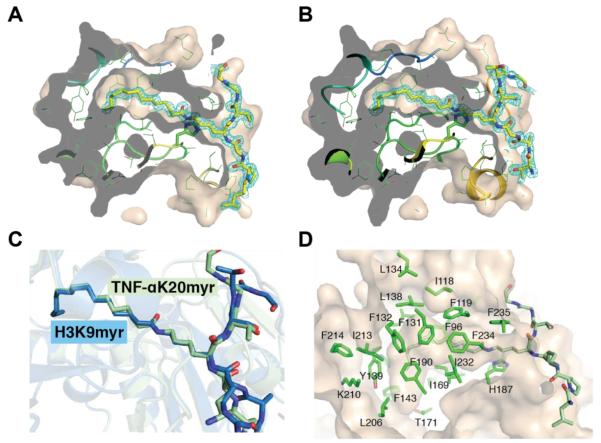
Figure 6. Analysis of myristoyl-lysine binding pocket.
A, 2Fo-Fc omit electron density map (cyan mesh, 1σ) of the TNF-αK20 myristoylated peptide. Molecular surface of SIRT2 cut at the level of the hydrophobic cavity are shown. The myristoylated peptides are drawn as sticks, in which yellow, blue and red represent C, N and O atoms, respectively. B, 2Fo-Fc omit electron density map (cyan mesh, 1σ) of the H3K9 myristoylated peptide represented as shown in A. C, superimposition of SIRT2 – TNFα-K20myr (light green) or SIRT2 – H3K9myr (blue) highlighting the orientation of the myristoylated lysine chain. D, hydrophobic pocket in SIRT2 that accommodates the myristoyl chain.

