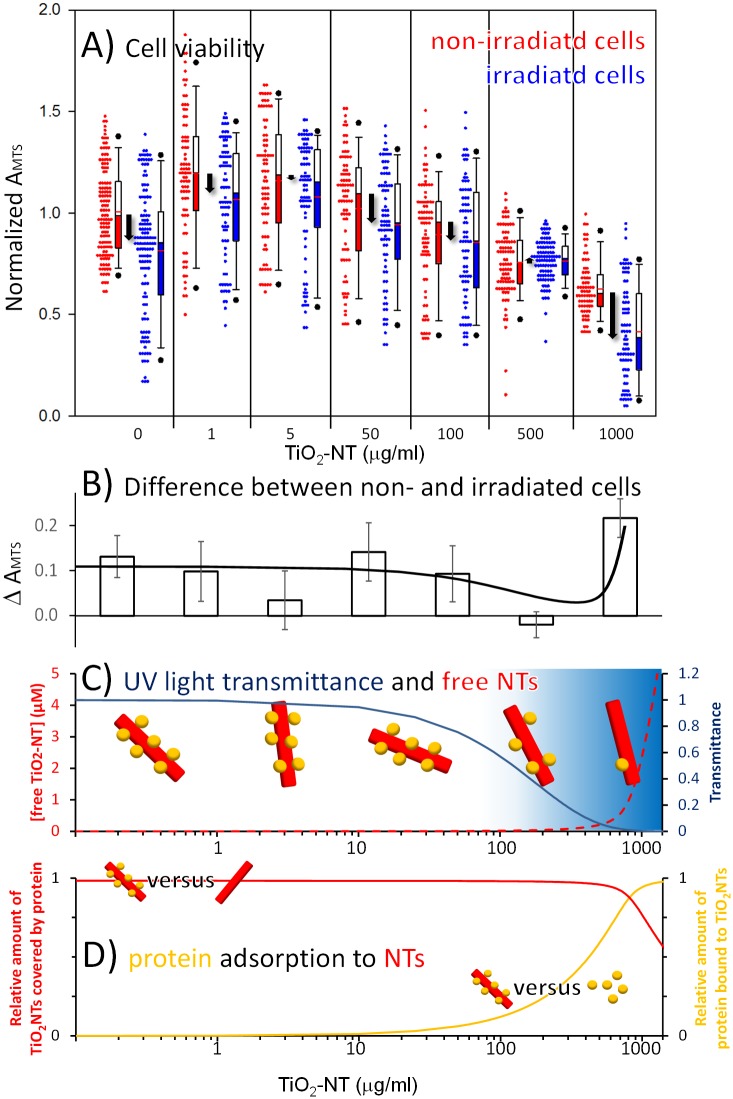
Fig 4. Cell viability versus concentration of TiO2-NTs in absence or presence of UV radiation.
Absorbance of MTS was measured as described in Materials and methods section. (A) Each non-irradiated data set (red symbols) is compared to a sample irradiated with UV light (blue symbols) at given concentration of TiO2-NTs. All Measurements are presented in a boxplot representing the distribution of the measured cell viability and described in Materials and methods. Differences in the cell viability between irradiated and non-irradiated cells are shown with the black arrows at each concentration of TiO2-NTs. The differences in the median values between the two groups at 0 and 1000 μg/mL and the two groups at 1 and 50 μg/mL of nanotubes are considered to be significant at P = <0.001, and P = <0.05, respectively. (B) Differences of median values of MTS absorbance between irradiated and non-irradiated cells, shown with the black arrows within the frame A, are plotted with the open bars. Solid black line represents the prediction of the difference in cell viability, based on the effect of the UV irradiation and phototoxic effect due to irradiated nanotubes not covered by serum proteins. Both contributions are shown separately in the frame C. (C) Solid dark blue line shows the transmittance of UV light versus the concentration of the nanotubes obtained experimentally (S2 Information. Optical properties of TiO2-NTs dispersion.), while dashed red line represents the concentration of the free nanotubes calculated as described in the S3 Information. Model of albumin binding to TiO2-NTs and best fit parameter values. (D) The relative amount of TiO2-NTs covered by the serum proteins (red line) and the relative amount of serum proteins bound to TiO2-NTs (yellow line) are shown as predicted by the model described in the S3 Information. Model of albumin binding to TiO2-NTs and best fit parameter values.

