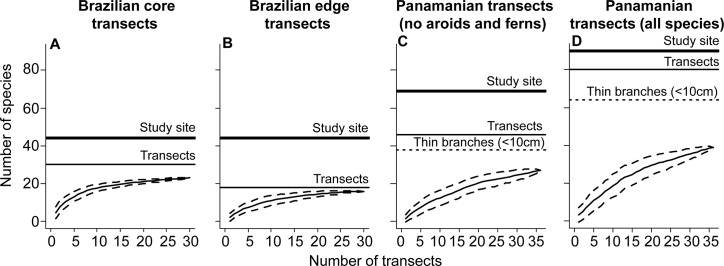
Fig 3. Species accumulation curves based on forest floor-based sampling of epiphytes.

A) Brazilian core transects (n = 30). B) Brazilian edge transects (n = 30). C) Panamanian transects, excluding ferns and aroids (n = 36). D) Panamanian transects, all species (n = 36). Solid curves give the mean number of species based on 100 randomized samplings, dashed curves the 95% CI. Horizontal lines indicate the number of species present in the canopy of the transects (thin lines), in the study site (thick lines, same estimate for both Brazilian study sites) and on substrate < 10 cm in diameter (dot line, in c and d). See S1 Table for the list of species found in the transects and S2 Table for species lists found in the study sites. Note that the Brazilian study sites showed curves leveling off, whereas the Panamanian site revealed a slightly steeper curve in agreement with the higher number of species.
