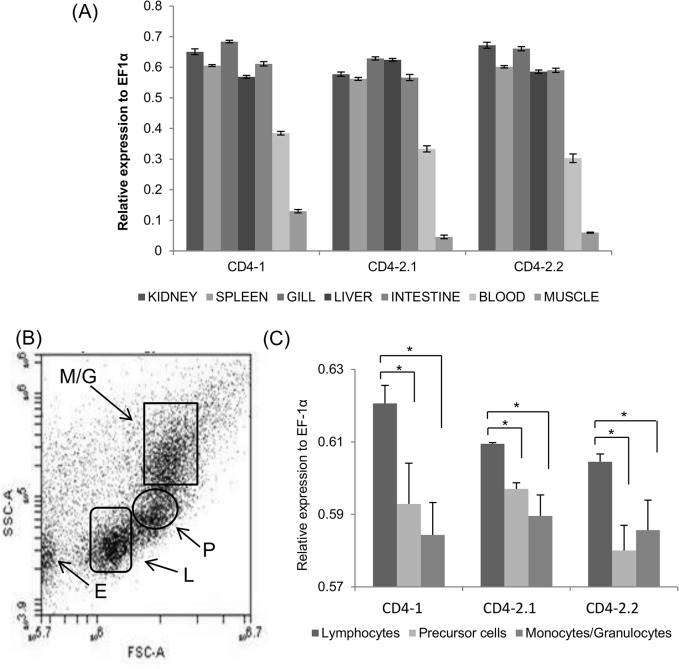
Fig 5. Zebrafish CD4-1/CD4-2 gene distribution.
(A) Tissue/blood expression of CD4-1/CD4-2 genes in zebrafish. (B) Cell profile obtained from FACS sorted zf kidney and spleen cells. E = erythrocytes, L = lymphocytes, P = (hemopoietic) precursor cells and M/G = monocytes/granulocytes. (C) Differential expression of the zfCD4-1/CD4-2 genes within the FACS sorted populations. *, p<0.05.

