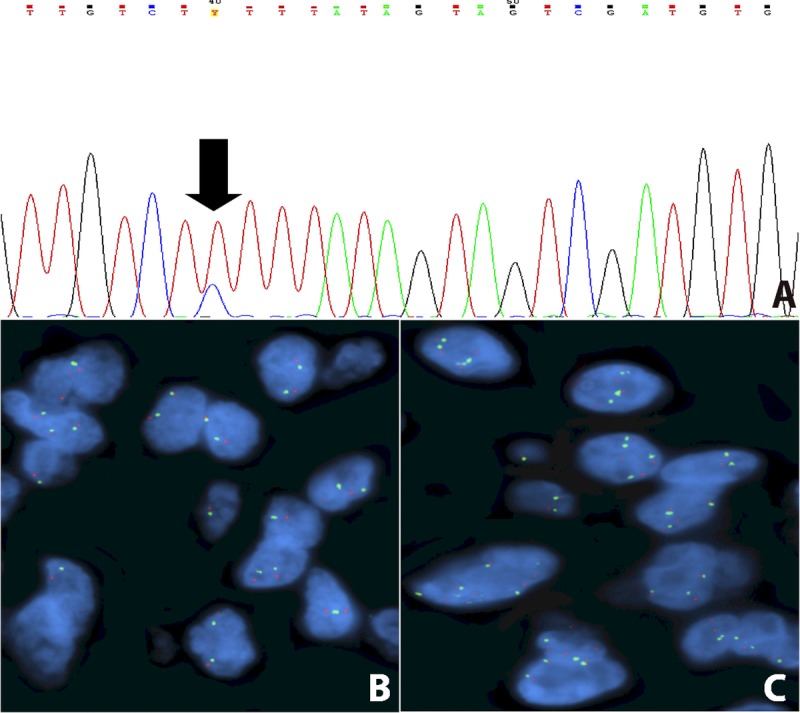
FIGURE 3.

Molecular alterations of FGFR1. (A) Electropherogram showing the point mutation K656E. (B, C) FISH assay displaying a normal pattern (B), and a case with low-copy number gain of the FGFR1 signal (C). The amount of FGFR1 signals (green) did not reach the cutoff value needed for the diagnosis of gene amplification.
