
Figure 7.
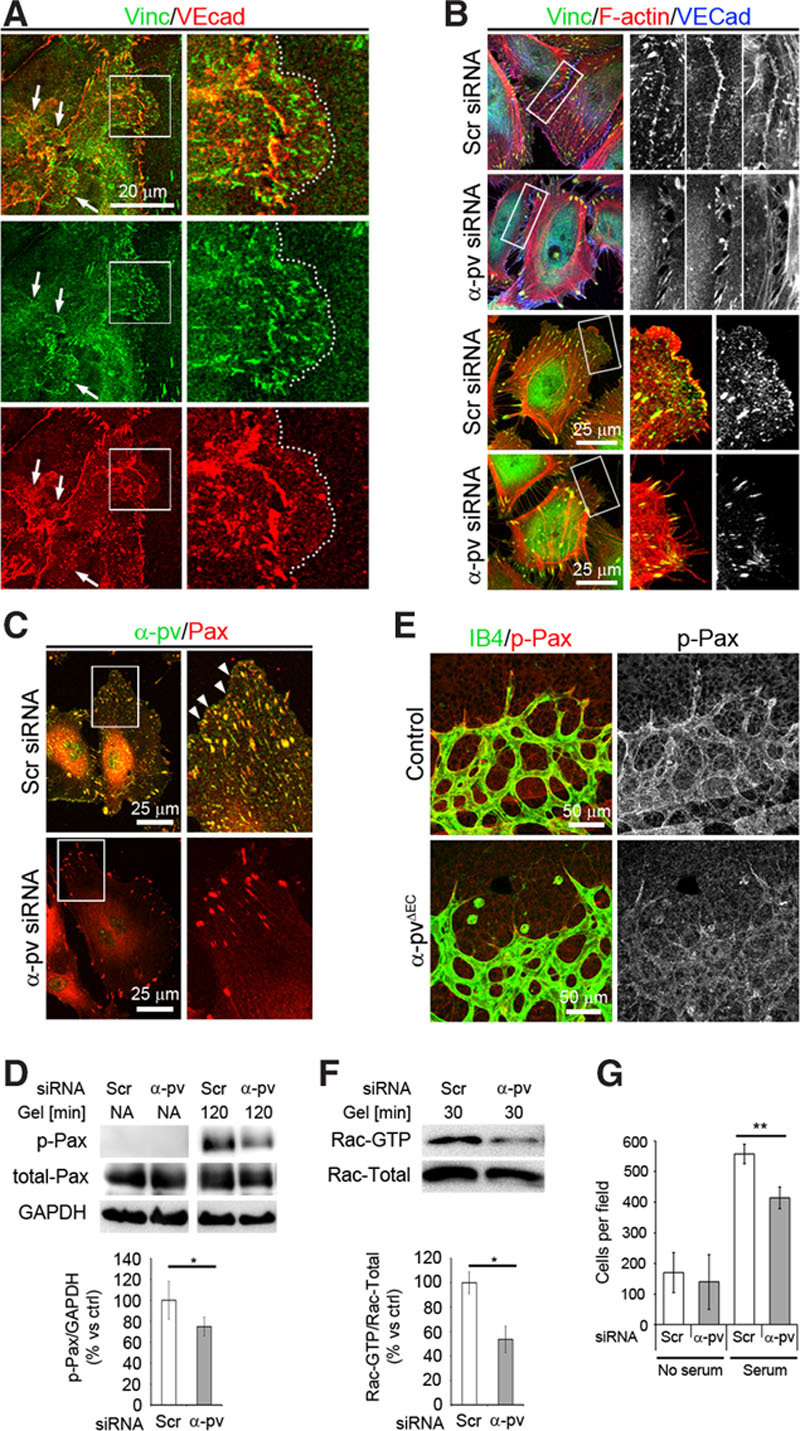
Depletion of α-parvin (α-pv) impairs formation of focal complexes (FXs) and decreased Rac activity. A, Double immunostaining of vinculin and VE-cadherin showing vinculin localization at leading edges of junction-associated intermittent lamellipodia (JAIL). Arrows point to JAIL. Dotted lines highlight the edge of a JAIL. B, Triple-fluorescent labeling for vinculin, F-actin, and VE-cadherin of control and α-pv–depleted human umbilical vein endothelial cells (HUVECs) cultured on gelatin. C, Double-fluorescent labeling for α-pv and paxillin of control and α-pv–depleted HUVECs cultured on gelatin for 12 hours. Arrowheads point to FXs. D (top), Phosphorylation of paxillin (Tyr118) was determined in nonadherent control and α-pv–depleted cells, and after 120 minutes adherence to gelatin. D (bottom), Quantification of paxillin phosphorylation; data represent relative mean values±SEM from 3 independent experiments. P value is 0.026. E, P7.5 control and α-pviΔEC retinas labeled for isolectin-B4 (IB4) and phospho-paxillin (Tyr118). F (top), α-pv–depleted HUVECs showed decreased Rac activity after 30 minutes on gelatin. F (bottom), Quantification of Rac-GTP vs total Rac; data represent relative mean values±SEM from 3 independent experiments. G, Quantification of chemotactic migration using serum as a chemoattractant (24 hours). Medium with 0.5% of serum was used to assess the baseline migration. EC indicates endothelial cell; and siRNA, small interfering RNA. ns P>0.05, *P≤0.05, **P≤0.01.