
Figure 5.
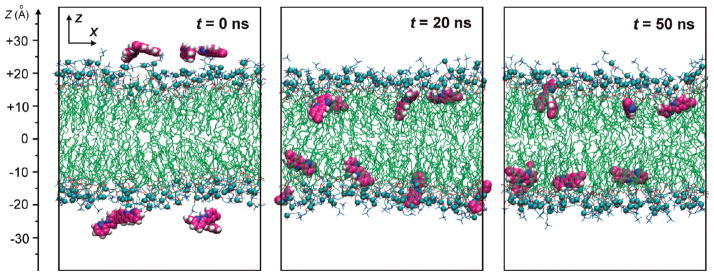
MD simulations of partitioning dynamics of 5M-PyIn-0 in a POPC bilayer are shown for different simulation periods. Snapshots of the MD system consisting of a hydrated POPC bilayer and eight molecules of 5M-PyIn-0, with four molecules on the top and bottom leaflet of the bilayer, are taken after t = 0, 20, and 50 ns of MD sampling. The molecules of 5M-PyIn-0 are drawn in van der Waals representation. Phosphorus atoms of POPC molecules are shown by cyan balls. For clarity, water molecules are not shown.