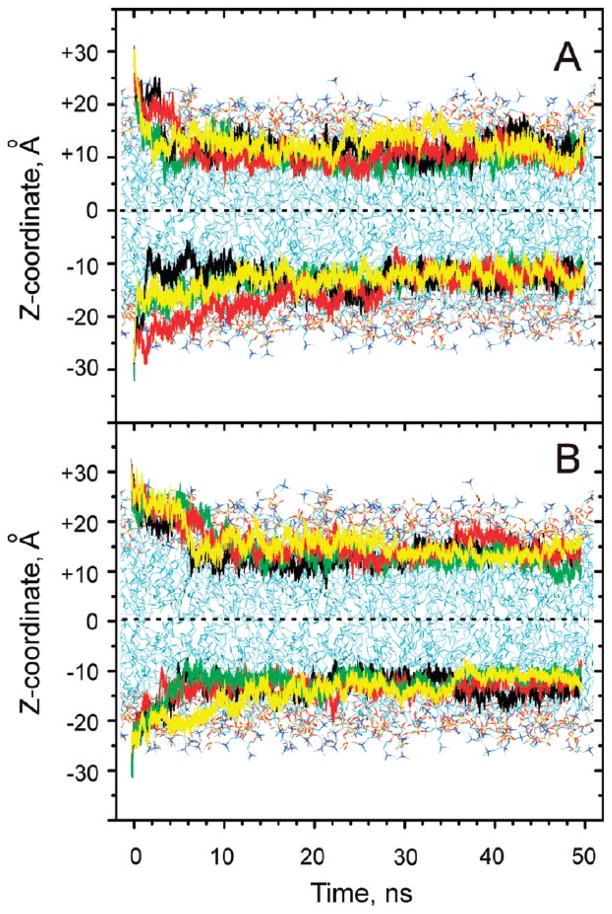
Figure 6.
Kinetics of partitioning of 5M-PyIn-0 (A) and DMPmIn-0 (B) in a POPC bilayer was monitored by COM of the probe molecules. The COM distances were calculated from the bilayer center along the z-axis for each of the eight probe molecules as a function of MD simulation time. For clarity, the COM distances for the four molecules on the top and bottom leaflet of the bilayer are black, green, red, and yellow and schematically superimposed on a bilayer snapshot.

