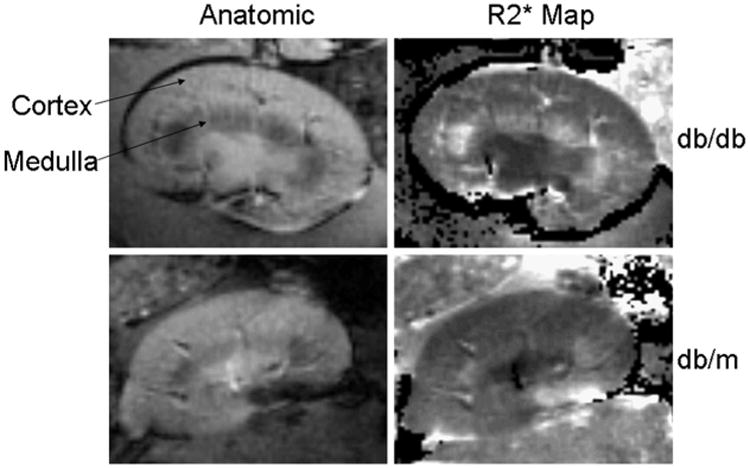
Figure 1.

Representative example of BOLD MRI data obtained in a diabetic db/db (upper panels) and a control db/m mouse (lower panels). The brightness on the R2* map reflects the relative oxygenation status of the kidney. The area of brightness in the OM of the db/db diabetic mice (right upper panel) is increased as compared with that of the db/m control mice (left lower panel), indicating a decreased tissue oxygenation.
