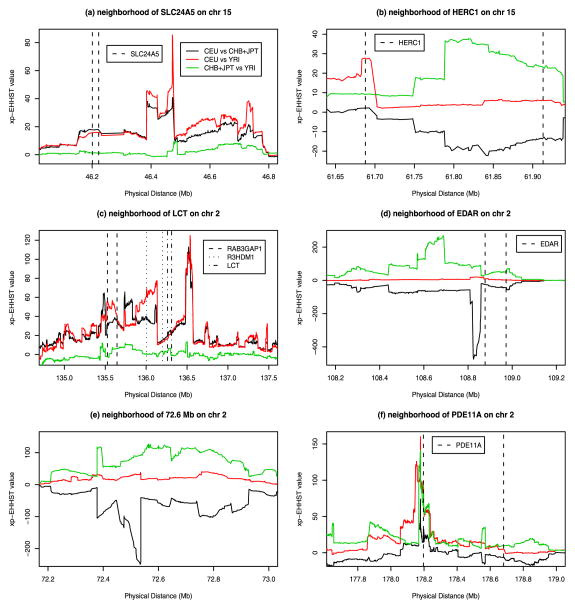
Figure 2.
The xp-EHHST values of three population samples of HapMap Phase II data: Graph (a) in the region of SLC24A5 gene and Graph (b) in the region of HERC1 gene on chromosome 15, Graph (c) in the region of RAB3GAP1, R3HDM1, LCT genes, Graph (d) in the region of EDAR gene, Graph (e) in the region around 72.6 Mb, and Graph (f) in the region of PDE11A gene on chromosome 2.

