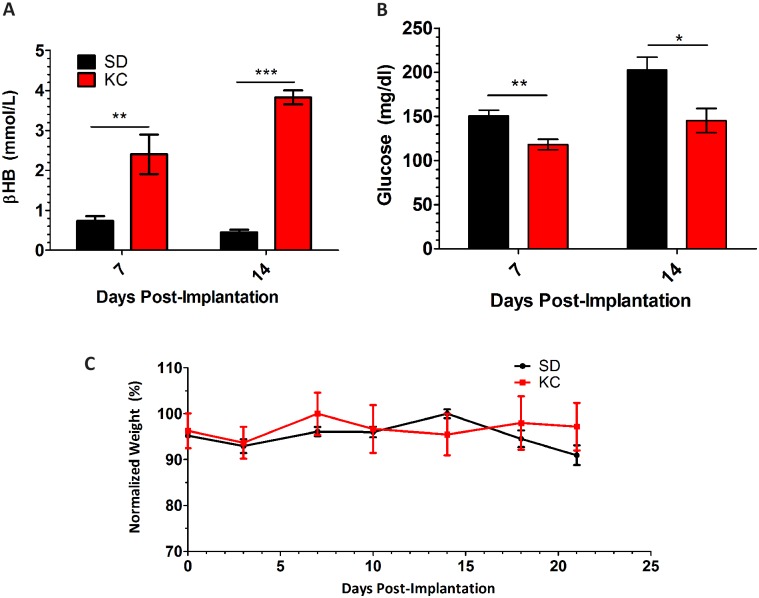
Fig 1. Weight, βHB and glucose measurements.
Blood ketone and glucose measurements show (A) higher βHB and (B) lower glucose in KC treated animals (C) weight measurements were taken every 3 days. Graph shows weights normalized to the average starting weight of each group. (N = 5; *p < 0.05; **p < 0.01; ***p < 0.001).

