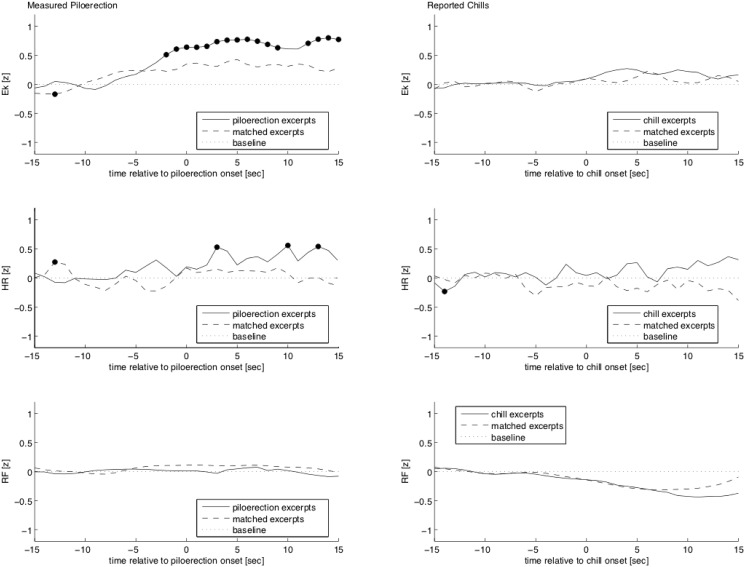
Fig 2. Time course of the chill response with piloerection (left column) and without piloerection (right column), 15 seconds before and after chill/piloerection onset (= 0s).
The first ten seconds of each period (-15 to -5 s period before piloerection onset) were considered as the baseline, and their mean value was subtracted from the entire passages (resulting in a zero baseline, depicted by the dotted line). The solid line depicts the response of subjects who experienced piloerection/chills. The dashed line depicts the data of subjects who did not experience piloerection/chills in the same stimulus passages. Black dots mark significant deviations from zero/baseline. Ek = emotional index Eκ, HR = heart rate, RF = respiratory frequency.

