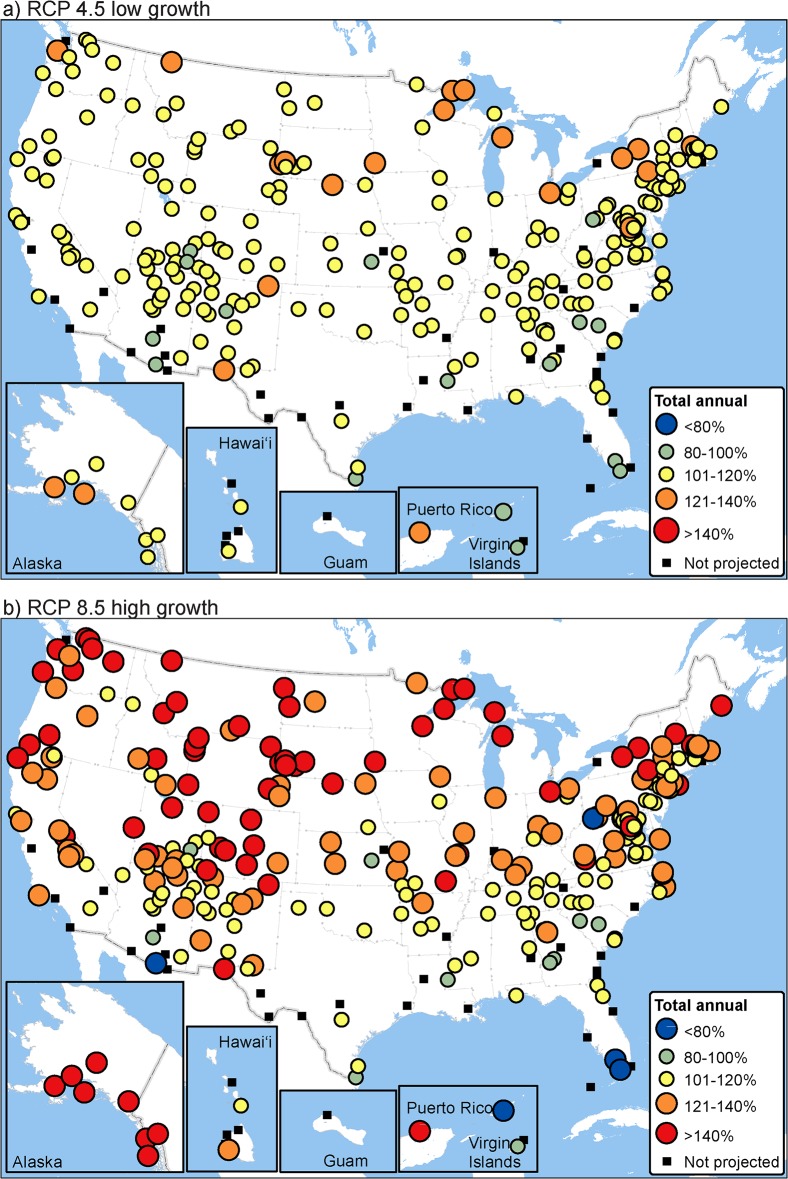
Fig 3. Potential future total annual visitation (2041–2060) expressed as a percentage of historical values (1979–2013).
Future visitation for each park is based on modeled monthly visitation relationship to temperature. Future projections, a) RCP 4.5 low growth and b) RCP 8.5 high growth, were limited to parks with temperature as an explanatory variable in the best-fit model and an adjusted R2 ≥ 0.5 (n = 282).

