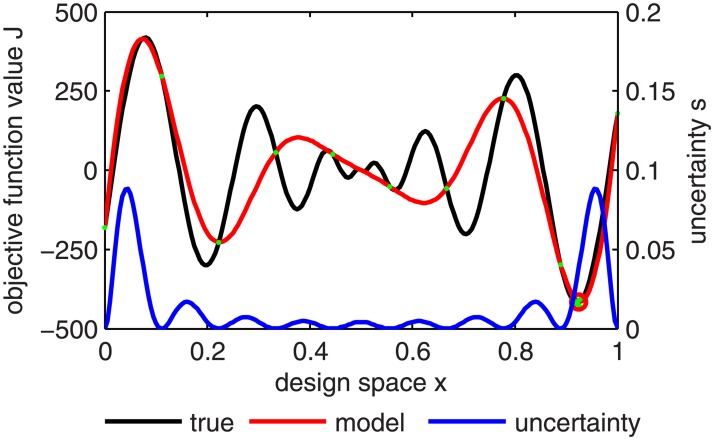
Fig 3. One-dimensional example of a Kriging interpolation hypersurface (red) of the true cost function hypersurface (black) based on 10 evaluated points P (green) with uncertainty s (blue) over the design space x.
The design space x and the cost function values form the cost function hyper-space. The true cost function minimum (green cross) could be almost perfectly identified by the Kriging model (predicted minimum marked by red circle) with only 10 points.

