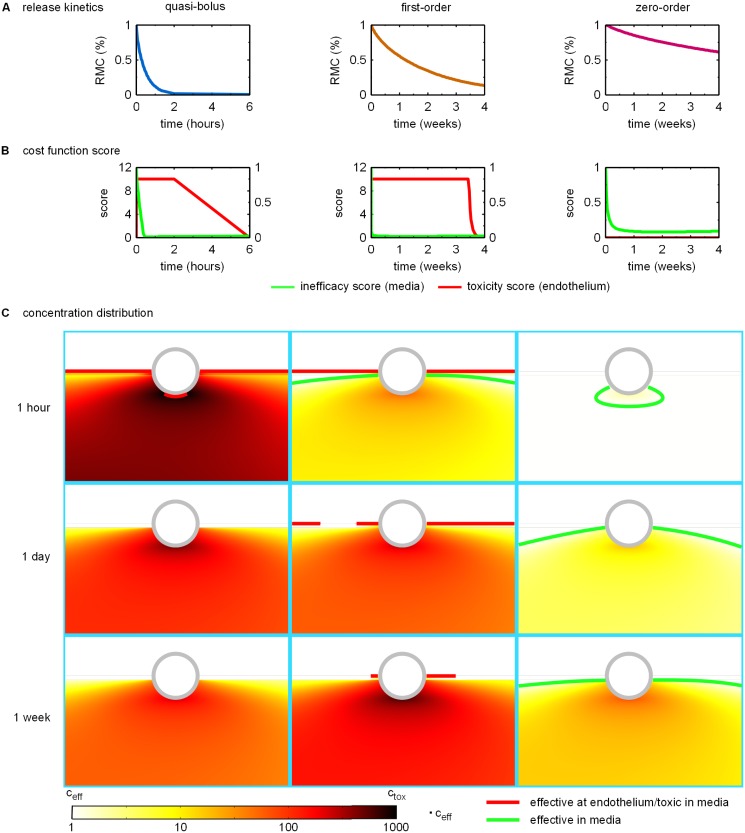
Fig 6. Release kinetics and resulting cost function scores and normalized concentration distributions for repesentative designs of quasi-bolus, first-order, and zero-order drug release.
A: Release profiles as quantified by the time evolution of the remaining mass percentage of drug in the polymer coating (RMC). B Time evolution of the endothelial toxicity score (left y-axis) and the inefficacy score (right y-axis). C: Contour plots of the concentration distribution normalized by the minimum efficacious concentration c eff at 1 hour (first row), 1 day (second row) and 1 week (third row) post stent implantation. The highest concentration values encountered close to the stent strut surface are colored in black indicating toxic concentrations. A green contour line marks the threshold between efficacious and non-efficacious drug concentration in the media. If the contour is missing, the entire depicted domain is exposed to efficiacious concentrations. The red countour lines enclose toxic concentration regions in the media and mark concentration levels at the endothelial surface that are unacceptably elevated.

