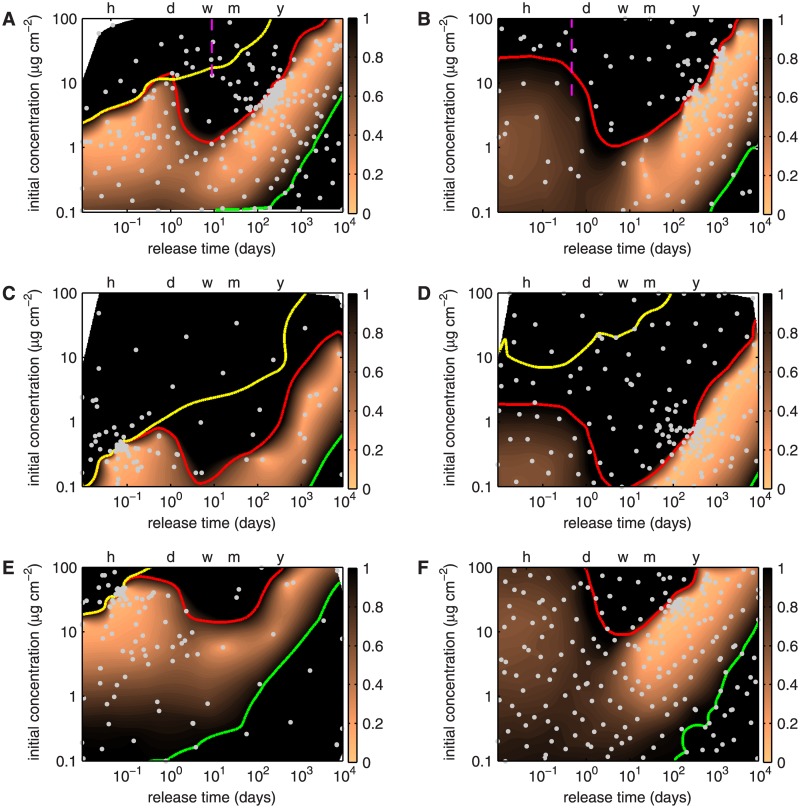
Fig 7. Contour plots of the cost function for paclitaxel (left column) and sirolimus (right column) over the design space consisting of initial concentration in the stent polymer c 0 and release time t E.
The scale for the cost function representation is truncated at a maximum of 1; all values larger than 1 are colored black. The dashed magenta lines in panels A and B mark the time scales for drug unbinding. The green contour line traces , the yellow contour line , and the red contour line . The horizontal axis at the top of the plot marks the time points of 1 (h)our, 1 (d)ay, 1 (w)eek, 1 (m)onth and 1 (y)ear. Gray dots indicate evaluated designs. Optimization cases A: paclitaxel release and B: sirolimus release with baseline cocnentration thresholds. C: Paclitaxel release and D: sirolimus release with concentration thresholds reduced by a factor of 10. E: Paclitaxel release and F: sirolimus release with concentration thresholds increased by a factor of 10.

