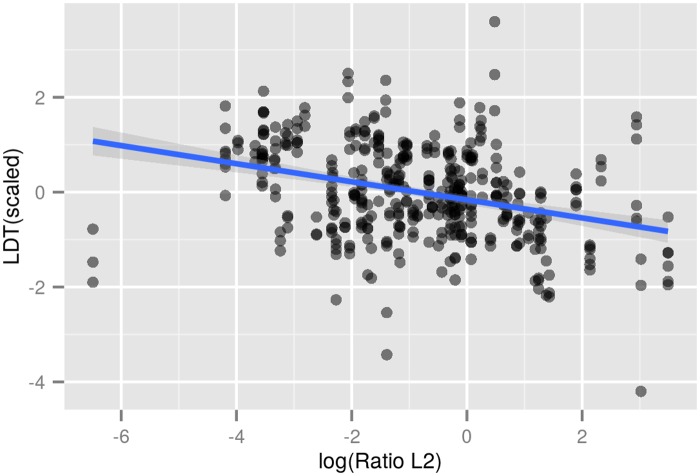
Fig 6. Linear regression.
Linear model for the relationship between the ratio of L2 speakers versus L1 speakers (logarithmically transformed) and scaled lexical diversities. Model parameters (β-coefficients, R 2-values and t-values are displayed in Table 3). The blue line indicates a linear model with the respective intercept and slope (coefficient) and 95% confidence intervals.

