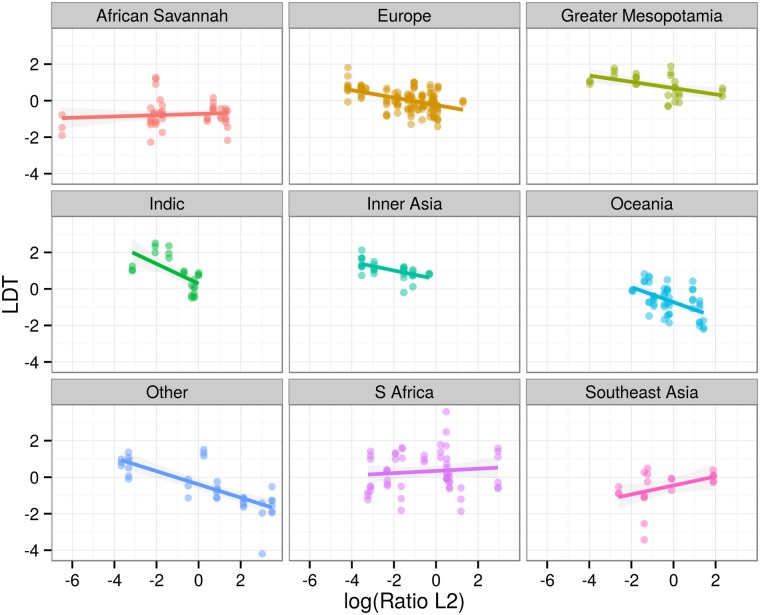
Fig 8. Regression plots by regions.
Scatterplots of log-transformed ratios of L2 speakers versus LDTs facetted by language regions. Colored lines represent linear models by families with 95% confidence intervals. Languages of regions with less than 10 texts are subsumed under “Other”. Note that this is just done for plotting, for statistical modeling language regions are not collapsed.

