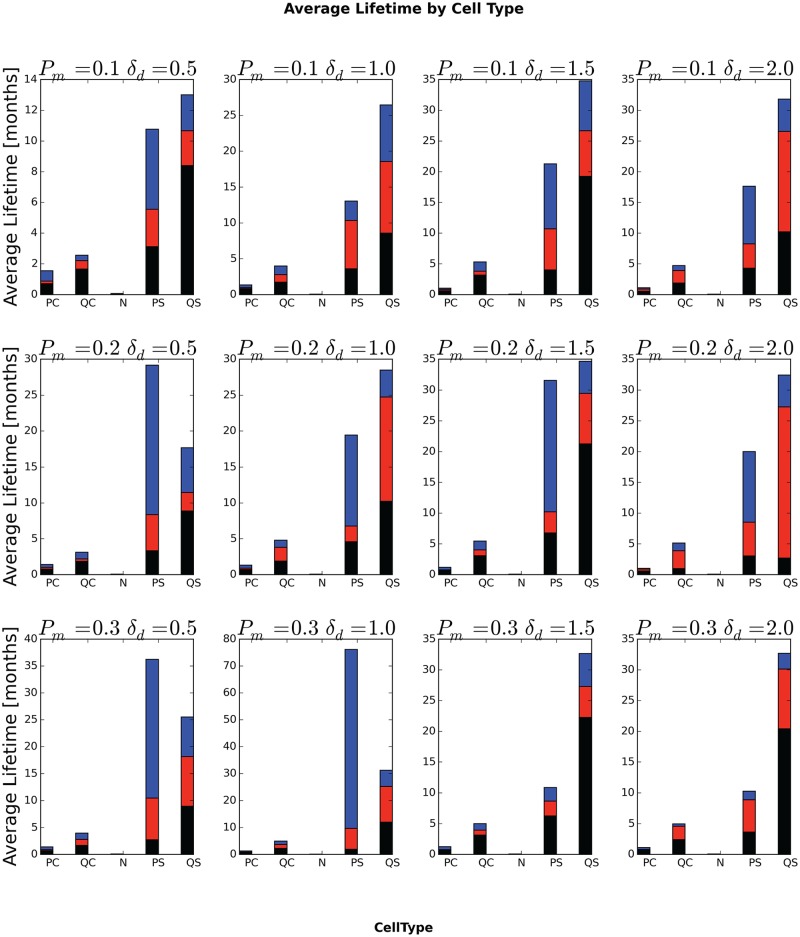
Fig 14. Average lifetime of generalized cells, by initial generalized-cell type.
In each bar, the black-red boundary is the minimum generalized-cell lifetime, the red-blue boundary is the median generalized-cell lifetime and the top of the blue portion is the maximum generalized-cell lifetime, all averaged over all cells of the specified initial generalized-cell type and over all replicas for a given P m and δ am.

