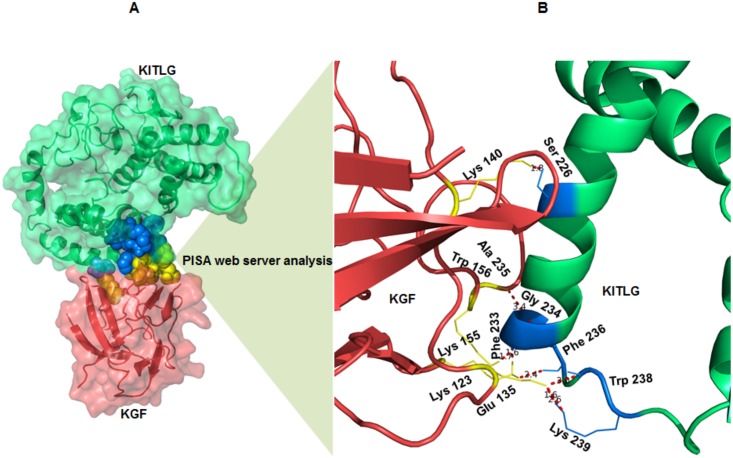
Fig 6. KGF-KITLG interacting interface and binding residues.
(A) Structural overview of KGF-KITLG interacting interface predicted by PISA, the interacting residues are shown in spheres (KGF: yellow and KITLG: blue). (B) A close view of KGF-KITLG binding interface showing the interacting residues corresponding to KGF and KITLG proteins in yellow and blue, respectively. Dotted lines (red) represent atomic distances between hydrogen bonds formed by binding residues.

