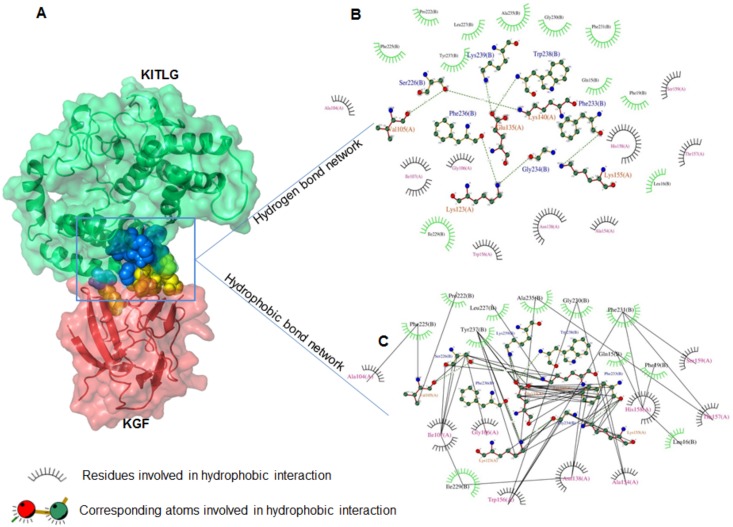
Fig 7. KGF-KITLG hydrophobic residual interactions.
(A) KGF-KITLG docked complex with spheres representing their binding interface. (B and C) DIMPLOT program generated two-dimensional plots representing hydrogen (B) and hydrophobic (C) interactions between KGF and KITLG proteins. Green and black (dashed) lines indicate hydrogen bonds and hydrophobic interactions in KGF-KITLG complex, respectively.

