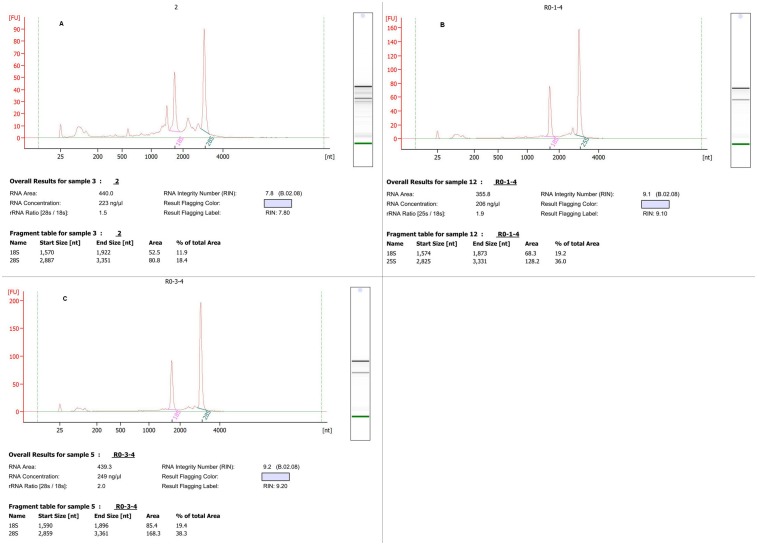
Fig 3. Bioanalyzer results of total RNA isolated using the method described in this study.
Isolations were made from three different tissues (leaves and roots) and run on an Agilent 2100 Bioanalyzer (A: leaf; B, C: root). The corresponding virtual gel image generated by the software is depicted on the right side of the electropherogram. The Plant RIN value assigned by the 2100 expert software (Rev. B.02.08.SI648) is indicated. The y axis represents fluorescence units (FU), and the x axis represents seconds (s).

