
Figure 1. Effect of TBI on body weight, onset and survival in wild type mice and in a mouse model of ALS (G93A).
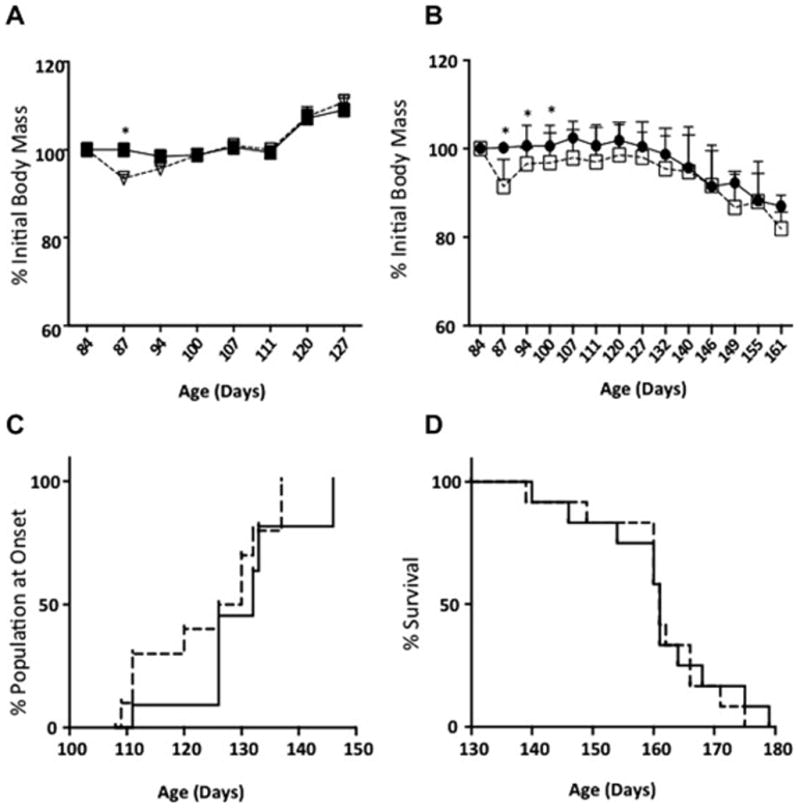
A. Body weight changes after TBI in wild-type mice. Sham group indicated by solid squares TBI group indicated by open triangles. B. Body weight changes in G93A transgenic mice after TBI. Sham group indicated by solid circles and TBI group indicated by open squares. C. Percent of G93A population at onset of disease as determined by the day of the first sign of body weight loss. There was no significant difference in the percent of the population at onset between sham (solid line) and TBI (dashed line) G93A mice. D. Survival analysis shows no effect of mild-TBI on median or maximum lifespan in G93A mice. Sham (solid line) and TBI (dashed line). Significance was measured using one way ANOVA followed by multiple t-tests corrected for multiple comparisons using the Holm-Sidak method. * denotes a statistical difference between groups, p<0.05.