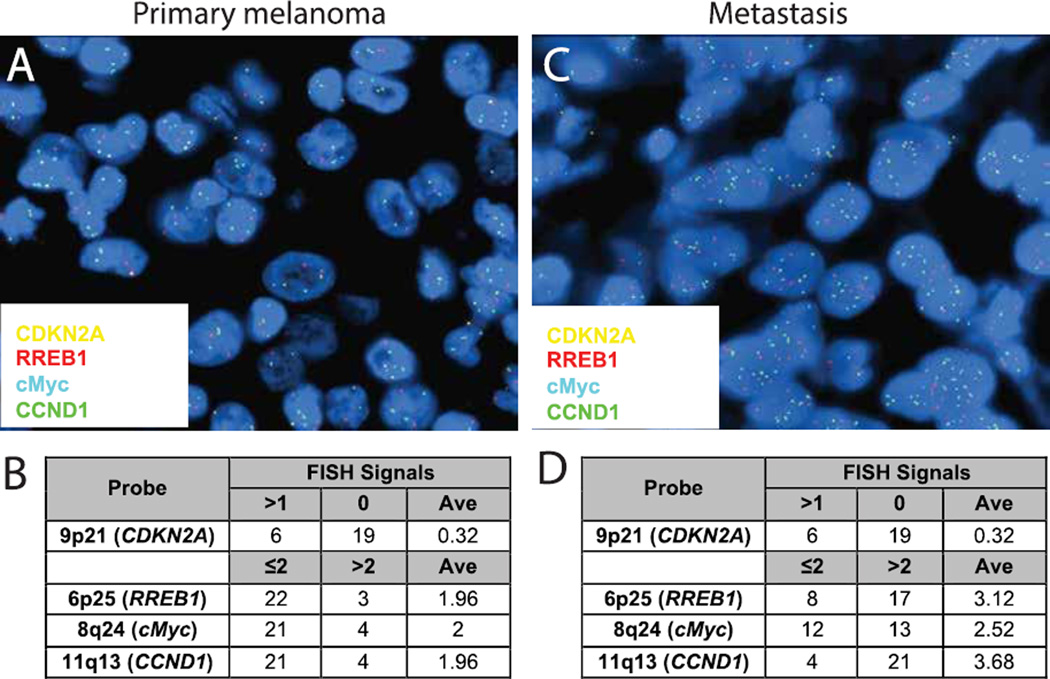
Figure 3.
FISH analysis of tumors. (A) Representative image of 4 probe analysis of primary melanoma shows homozygous loss of CDKN2A. (B) Table summarizing the scoring of signal number from 25 cells. Average (Ave) indicates the mean number of foci per nuclei. (C) FISH from metastatic melanoma shows homozygous loss of CDKN2A but increased signals from all remaining probes suggested genomic instability and possible aneuploidy. (D) Table summarizing the scoring of the brain lesion.

