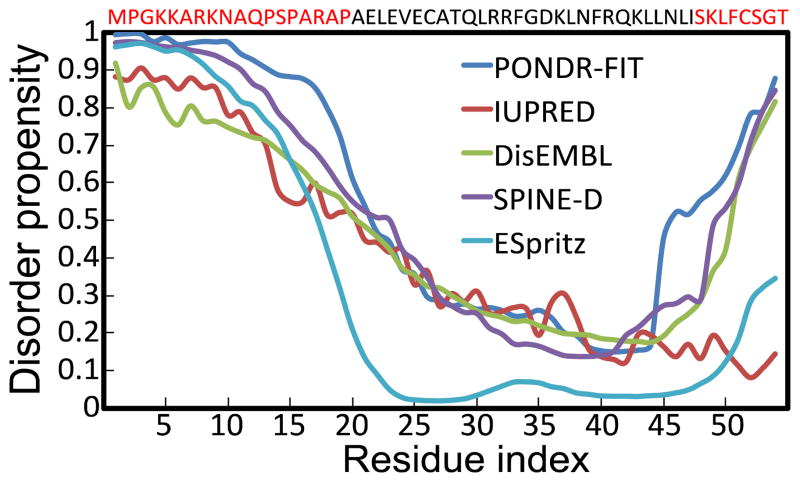
Fig. 1. Disorder analysis of Noxa using multiple prediction algorithms.
The plot shows the disorder propensity of each amino acid in Noxa. All prediction algorithms use the same disorder scale: residues with values between 0 and 0.5 are considered structurally ordered, whereas residues with disorder propensity values between 0.5 and 1 are considered structurally disordered. The sequence of Noxa is shown at the top of the graph, and residues that are likely to be disordered based on disorder prediction algorithms are shown in red.

