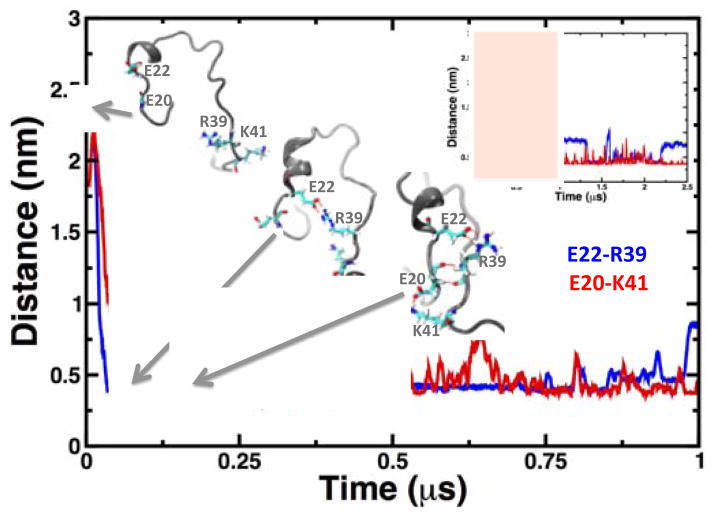
Fig. 5. Time-dependent changes in the distance distances E22-R39 and D20-K41.
We calculated the distances between Cδ of glutamate and Cζ and Nζ of arginine and lysine, respectively. The formations of salt bridges at different times are shown as grey cartoons; the residues involved in salt-bridge formation and β-nucleation are shown as sticks. The main plot shows the distances calculated only for the first 1 μs in the trajectory; the inset plot shows the changes in interresidue distances for the entire 2.5 μs of simulation time.

