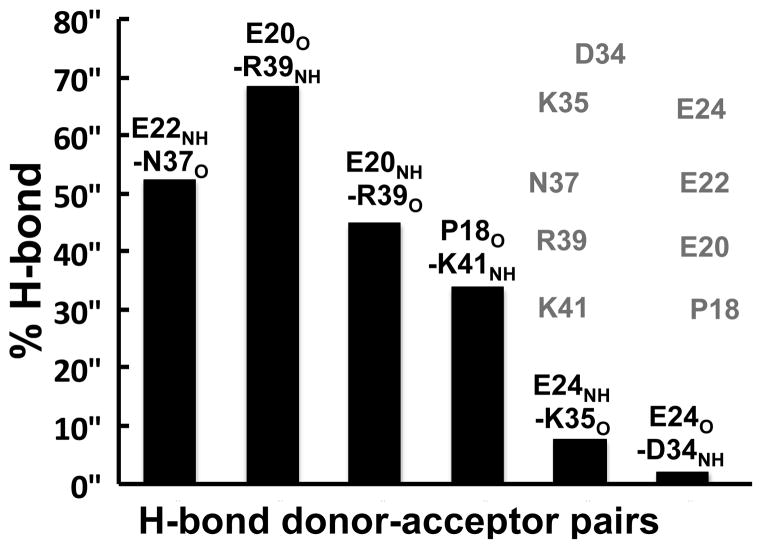
Fig. 6. Occurrence of interstrand hydrogen bonds.
% H-bond was calculated between t=1 μs and t=2.5 μs using individual structures at time intervals of 0.04 μs. The cartoon shows the location of the hydrogen bond donors and acceptors located at the interface of the β-sheet. Backbone atoms are shown as van der Waals spheres and colored according to atom type: oxygen (red), nitrogen (blue), carbon (cyan) and hydrogen (white).

