Fig. 1.
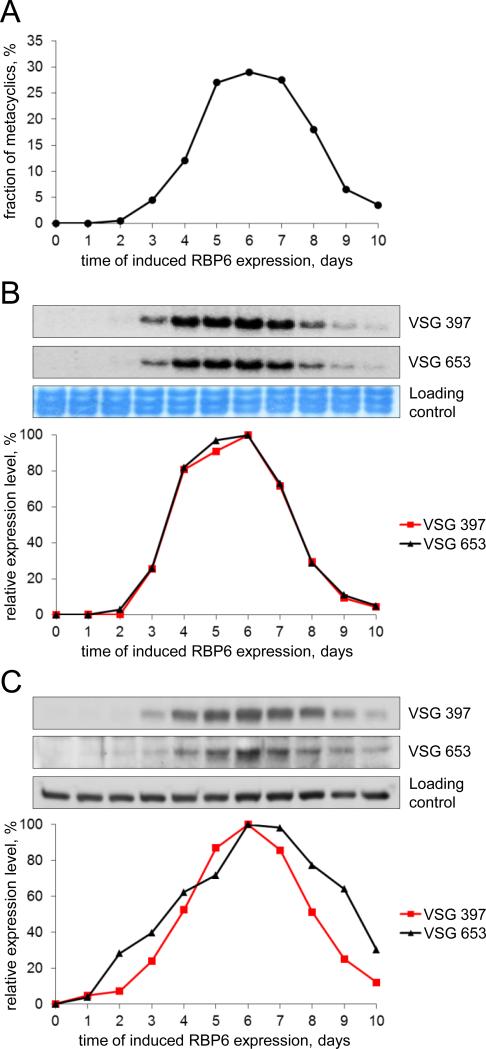
Timeline of mVSG mRNA and protein expression and metacyclic cell proportion in cultures of T. brucei Lister 427 (29-13) induced to express RBP6. Cells were grown and induced with doxycycline as described previously [15] in the presence of 4.5 g/L glucose. (A) The percentage of metacyclic cells on each day of induced RBP6 expression was obtained as in [15] and cell samples were collected and processed for isolating total RNA or lysed with SDS-containing buffer. (B) Northern blots with equal amount of total RNA per sample (top) and probes specific for VSG 397 and VSG 653 were quantified with ImageQuantTL software (GE) (bottom). Large rRNAs stained with methylene blue are the loading controls. Day 0 of induction is set as 0% mVSG mRNA expression and the time point with highest value is set as 100% mVSG mRNA expression. (C) Western blots with equal cell number equivalents (top) processed with rabbit serum against the VSG 397 peptide CSDDAATYTSGSIAGTHALG (dilution 1:2,000) and rat serum against the VSG 653 peptide CRLHSGADNEGVVQNAGADN (dilution 1:1,000) were quantified with GeneTools software (Syngene) (bottom). A cross-reacting band served as a loading control. Day 0 of induction is set as 0% mVSG expression and the time point with highest value is set as 100% mVSG expression.

