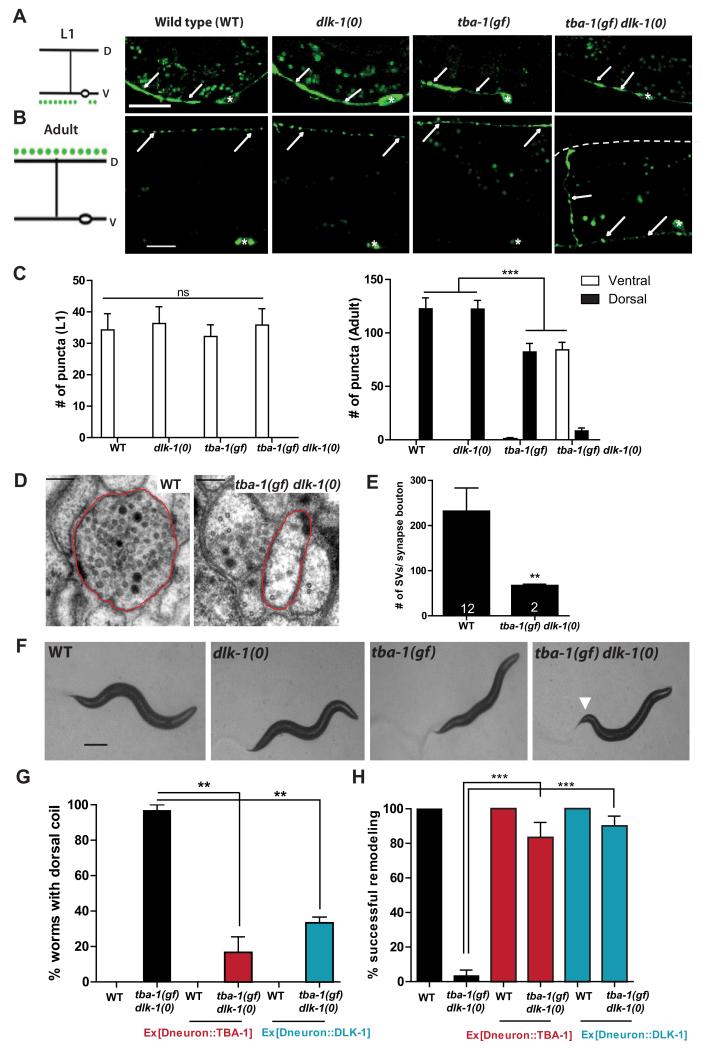
Figure 1. tba-1(gf) dlk-1(0) animals are defective in DD remodeling.
(A, B) Representative images of DD synapses (Pflp-13-SNB-1::GFP (juIs137)) in L1 and adult animals. White arrows indicate the location of synaptic vesicles; white asterisks, DD cell bodies in the VNC; and dashed white line, the location of DNC in tba-1(gf) dlk-1(0). Scale bars: 10 μm.
(C) Quantification of synaptic puncta in the VNC and DNC of L1 (left) and adult (right) animals. Data are mean ± SEM; n=10 animals per genotype. Statistics: One-Way ANOVA followed by Tukey’s posttest; ***p<0.001, ns-not significant.
(D) Representative EM sections of DD neuron processes in the DNC. Axonal process of a DD neuron is outlined in red. Scale bar: 100 nm.
(E) Quantification of the number of synaptic vesicles in DD synapse boutons (sections containing an active zone). Data are mean ± SEM; n=number of synapse boutons (on graph). Statistics: unpaired t-test with Welch’s correction; **p<0.01.
(F) Bright field images of the typical body posture on food. White arrow represents bent tail in tba-1(gf) dlk-1(0). Scale bar: 200 μm.
(G, H) Cell autonomous rescue of the behavioral (G) and synapse remodeling (H) defects of tba-1(gf) dlk-1(0) using Punc-25 driven TBA-1 or DLK-1. Data are mean ± SEM; n=30 animals per genotype. Statistics: One-Way ANOVA followed by Tukey’s posttest; **p<0.01, ***p<0.001. See also Figure S1.

