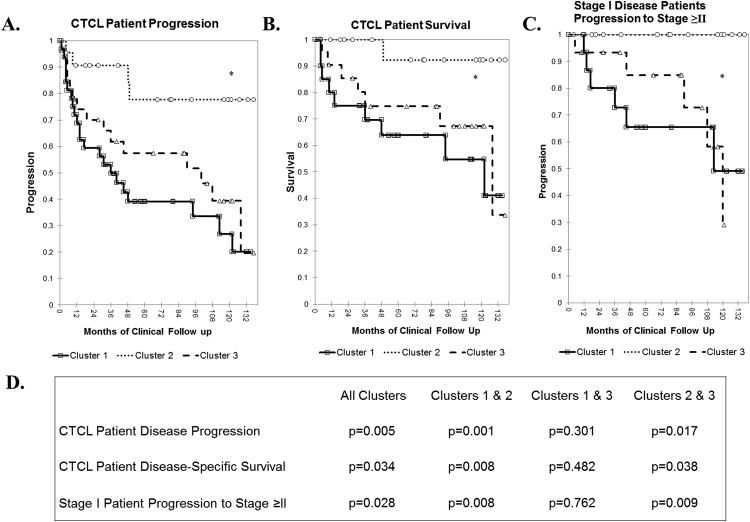
Figure 4.
Kaplan-Meier analysis of CTCL patient disease outcomes A. CTCL patient overall disease progression (defined as progression to a higher clinical stage and/or death, p=0.005) B. CTCL patient disease-specific survival, p=0.034 C. Progression of patients with stage I disease to more advance stages (i.e., stage ≥II). D. p-Values for Kaplan-Meier comparisons for each individual cluster pair.

