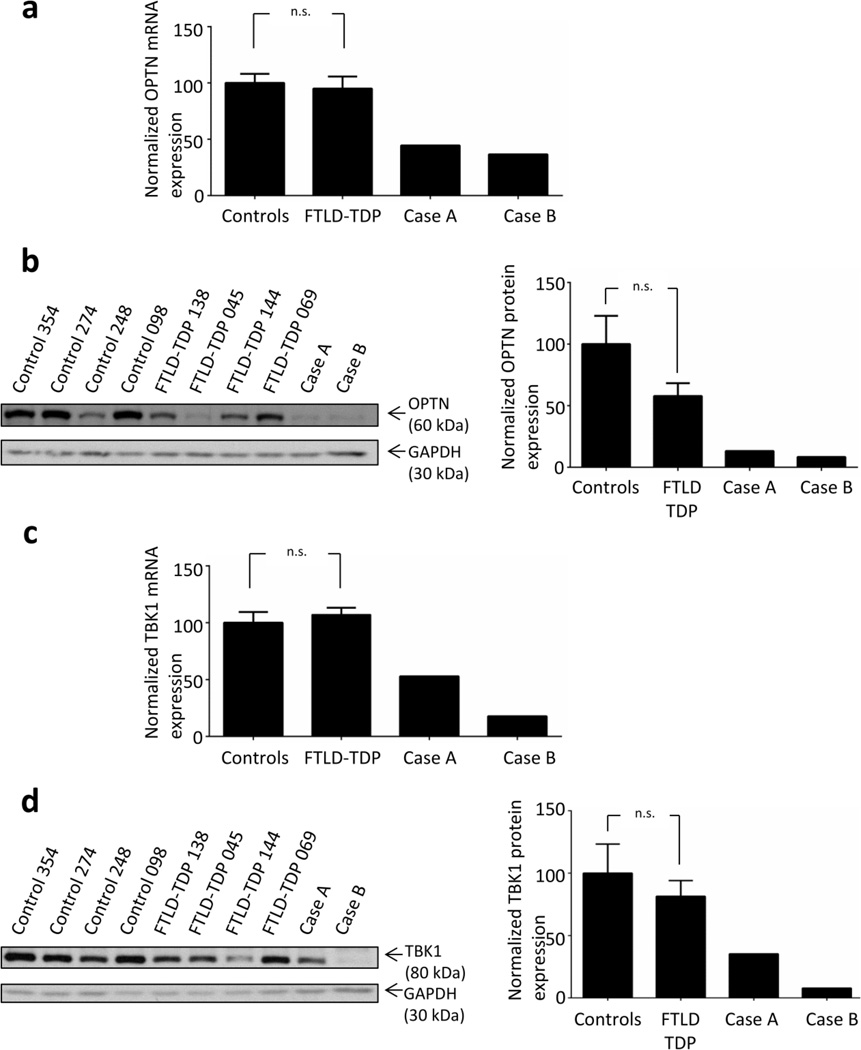
Figure 2. Loss of function variants in OPTN and TBK1 reduce mRNA and protein expression.
(a) Relative OPTN mRNA expression levels normalized to RPLPO for cases A and B and 6 FTLD-TDP cases without mutations in OPTN and TBK1 are represented relatively to 4 control brains. (b) Representative western blot showing OPTN and GAPDH protein levels (left panel) in cases A and B, 4 FTLD-TDP cases without mutations in OPTN and TBK1 are 4 normal control brains. The relative quantification of OPTN protein (from 2 independent protein extractions) for cases A and B as well as FTLD-TDP cases without mutations in OPTN and TBK1 (n=6) and controls (n=6) is shown in right panel. (c) Relative TBK1 mRNA expression levels normalized to RPLPO for cases A and B and 6 FTLD-TDP cases without mutations in OPTN and TBK1 are represented relatively to 4 control brains. (d) Representative western blot showing TBK1 and GAPDH (left panel) for cases A and B, 4 FTLD-TDP cases without mutations in OPTN and TBK1 and 4 normal control brains. The relative quantification of TBK1 protein (from 2 independent protein extractions) for cases A and B as well as for 6 FTLD-TDP cases without mutations in OPTN and TBK1 (n=6) and controls (n=6) is shown in right panel. For all panels, the error bar +/− SEM is shown. n.s.: not significant after a Mann-Whitney test.

