
Figure 2. Variation Between Regions in Risk- and Reliability-Adjusted Mortality in 2012.
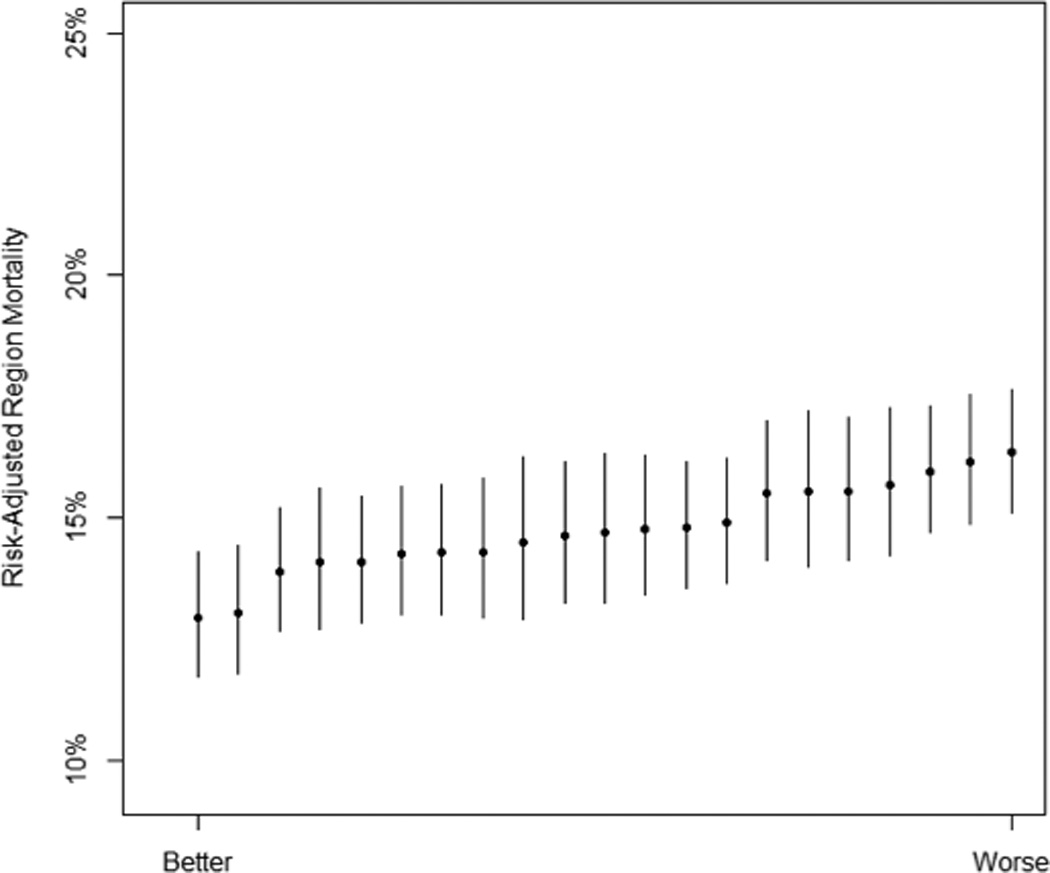
Error bars from the region-level random effects are shown at 1.4 times the standard error, indicating that two regions have significantly different performance if their error bars do not overlap. Regions are ranked by performance.